Key Points
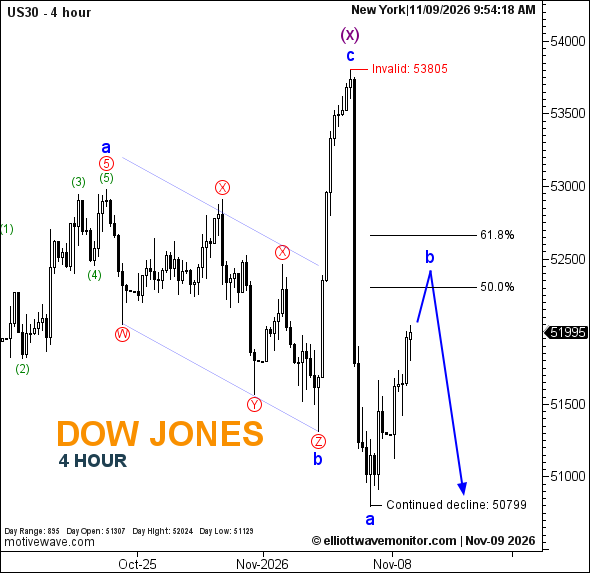
- Dow Jones now marks blue wave a after the earlier c–(x) recovery, with a possible wave b rebound ahead.
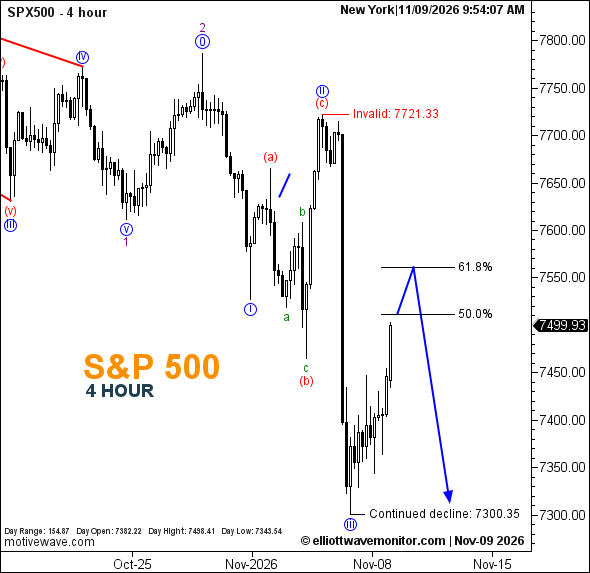
- S&P 500 moved beneath its previous downside reference of 7,452.83; a corrective rise is now projected before renewed weakness.
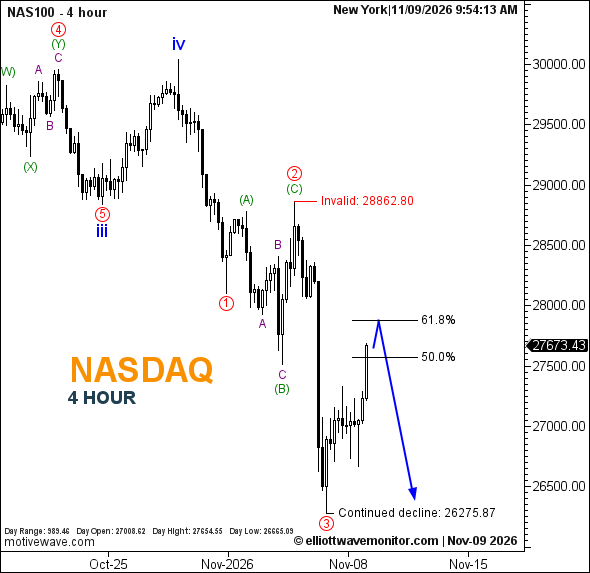
- Nasdaq 100 retains a bearish path under its newly approved invalidation level of 28,862.80.
The sharp reversal in Dow Jones (US30) marks an important structural development in the November 9 four-hour index review. The blue wave c rise anticipated in the November 4 Dow Jones analysis is now labeled at the peak alongside purple wave (x). The ensuing decline is marked as blue wave a near 50,799, followed by an observed recovery. At 9:54:18 a.m. New York time, the chart displayed 51,995.
The forward blue path does not extend that recovery indefinitely: it first projects completion of blue wave b around the 50% Fibonacci reference, below the separately marked 61.8% line, before another decline toward 50,799. The bearish count is invalidated at 53,805. The forecast b-wave endpoint and subsequent downswing are still prospective.
The S&P 500 (SPX500) has also moved beyond a prior bearish milestone. The November 4 S&P 500 report described a developing green W–X correction and cited 7,452.83 as an unconfirmed downside reference. The updated chart places blue wave (ii) at the preceding high and blue (iii) at a later trough beside the 7,300.35 continuation label. That sequence records movement below the earlier reference, although it does not establish that the next decline has begun. The displayed snapshot price was 7,499.93 at 9:54:07 a.m. New York time.
From the last observed candles, the projected path allows an upward correction through the 50% retracement toward 61.8%, then turns down toward 7,300.35. The current invalidation is 7,721.33. Those Fibonacci markers are ratios, not independently published numerical price targets.
For Nasdaq 100 (NAS100), the principal change is in the internal wave interpretation. The November 4 Nasdaq analysis projected a red C rebound toward approximately 29,100 before further weakness. The new chart instead labels red waves 1–2–3: red 2 and green (C) coincide at the intervening recovery high, while red 3 marks the subsequent low near 26,275.87. The snapshot price was 27,673.43 at 9:54:13 a.m. New York time.
An additional corrective recovery toward the 50%–61.8% Fibonacci references is projected before another possible slide toward 26,275.87. The analyst has expressly replaced the earlier 30,042.46 invalidation with 28,862.80 for the current bearish scenario. The low at 26,275.87 is a prior structural reference, not the November 9 daily low.
Technical Outlook — H4
| Index | Projected sequence | Downside continuation reference | Current invalidation |
|---|---|---|---|
| Dow Jones (US30) | Blue b rebound, then potential decline | 50,799 | 53,805 |
| S&P 500 (SPX500) | Recovery toward 50%–61.8%, then potential decline | 7,300.35 | 7,721.33 |
| Nasdaq 100 (NAS100) | Recovery toward 50%–61.8%, then potential decline | 26,275.87 | 28,862.80 |
US Indices News Today: US stock markets advanced on Monday, with the Dow Jones, Nasdaq, and S&P 500 rebounding from last week's losses. The recovery was supported by improving risk appetite and declining oil prices, despite continued pressure on some technology stocks. Meanwhile, investors remain focused on upcoming US inflation data for fresh insights into the Federal Reserve's monetary policy outlook, as uncertainty persists over the sustainability of the market recovery.
Trader's Question: Does a retracement to 50% or 61.8% confirm that the next bearish leg has started?
Answer: No. The blue paths describe a projected recovery followed by a possible decline. Evidence of a subsequent reversal is still needed for each index; the Fibonacci lines alone do not confirm that turning point.