Key Points
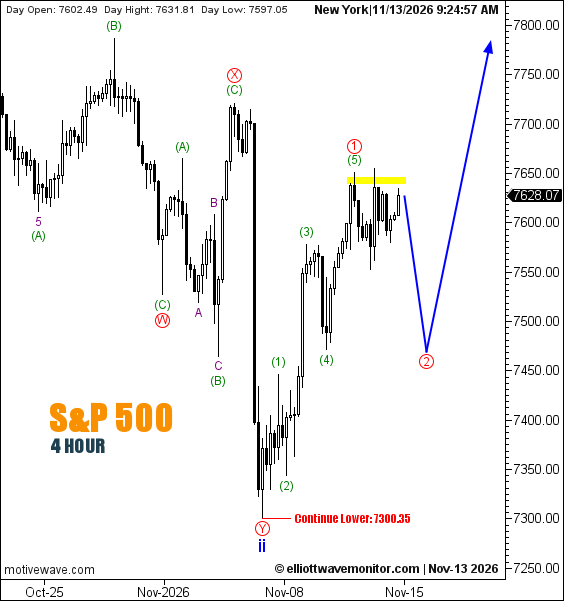
- S&P 500: A five-wave green advance is now labeled as completed provisionally at red wave 1; the chart projects a red wave 2 pullback followed by another rise.
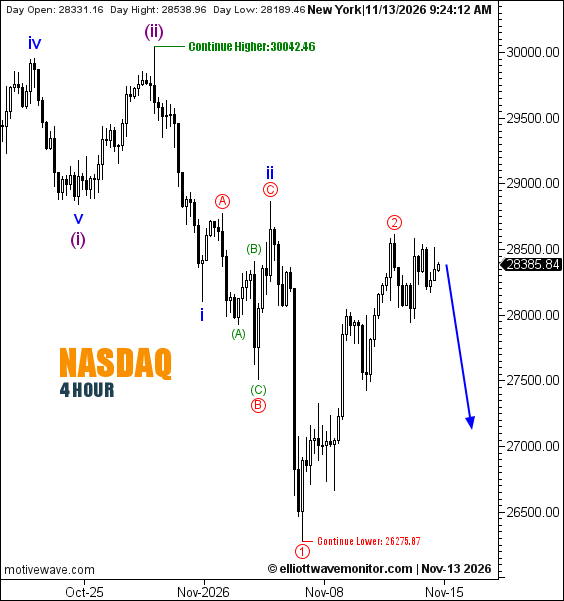
- Nasdaq 100: Red wave 2 is marked at the recovery high, with the blue arrow projecting renewed weakness rather than another rebound first.
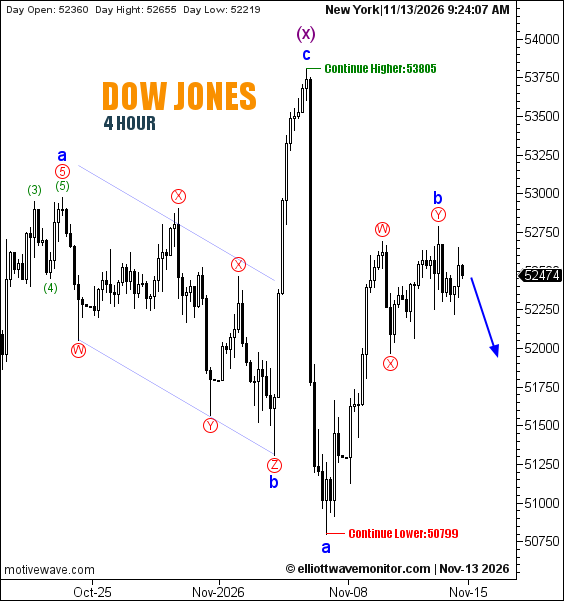
- Dow Jones: The blue wave b recovery is provisionally labeled at its high, alongside the red W–X–Y correction; the next blue path slopes downward.
The most significant change in the S&P 500 (SPX500) four-hour structure is the transition from an advancing recovery to a possible second-wave correction. In the November 11 S&P 500 outlook, the analyst projected further upside, an intervening retreat and another advance. The November 13 chart now marks green waves (1)–(5) into a recent peak labeled red wave 1, while the connected blue projection first declines toward a prospective red wave 2 and then turns upward. That second wave and the later advance are still forecasts, not completed movements.
At 9:24:57 a.m. New York time, the SPX500 chart displayed 7,628.07, with a recorded daily high of 7,631.81 and low of 7,597.05. The current horizontal label 7,300.35 reads Continue Lower. It is not marked as invalidation, and the chart supplies neither a numerical endpoint for red wave 2 nor a final upside target.
A different stage is visible in Nasdaq 100 (NAS100). The November 11 Nasdaq assessment still anticipated a corrective rebound toward red wave 2 before a potential decline. The updated chart places red wave 2 at the observed recovery high, following red wave 1 at an earlier trough. At 9:24:12 a.m. New York time, NAS100 displayed 28,385.84, with a daily high of 28,538.96 and low of 28,189.46. Its blue forecast arrow now points lower from the latest candles, without an initial rising stage.
The chart labels 30,042.46 Continue Higher and 26,275.87 Continue Lower. Neither is labeled a formal invalidation; nor does the arrow's endpoint establish 26,275.87 as a completed target.
For Dow Jones (US30), the corrective rebound discussed in the preceding US30 report has developed into a more fully labeled structure. Red W–X–Y subdivisions terminate at a peak also marked blue wave b, after the prior blue wave a low. The November 13 snapshot displayed 52,474 at 9:24:07 a.m. New York time, against a recorded high of 52,655 and low of 52,219. From the last candle, the single blue projected path points downward; no later descending wave is assigned an additional label on the chart.
The active annotations are 53,805 — Continue Higher and 50,799 — Continue Lower, not explicit invalidation levels. A renewed decline remains conditional on subsequent price action.
Technical Outlook — H4
| Index | Observed structure | Projected sequence | Continue Higher | Continue Lower |
|---|---|---|---|---|
| SPX500 | Red wave 1 labeled at the green five-wave high | Red wave 2 correction, then possible rise | Not labeled | 7,300.35 |
| NAS100 | Red wave 2 marked at the rebound high | Further downside | 30,042.46 | 26,275.87 |
| US30 | Blue wave b and red Y labeled at the recovery high | Further downside | 53,805 | 50,799 |
Trader's Question: Are the numbers previously described as invalidation levels still invalidation levels?
Answer: Not in these November 13 drawings. The analyst explicitly labels them Continue Higher or Continue Lower. None of the three current charts provides a separately labeled invalidation level, so the former descriptions must not be carried forward automatically.