Key points
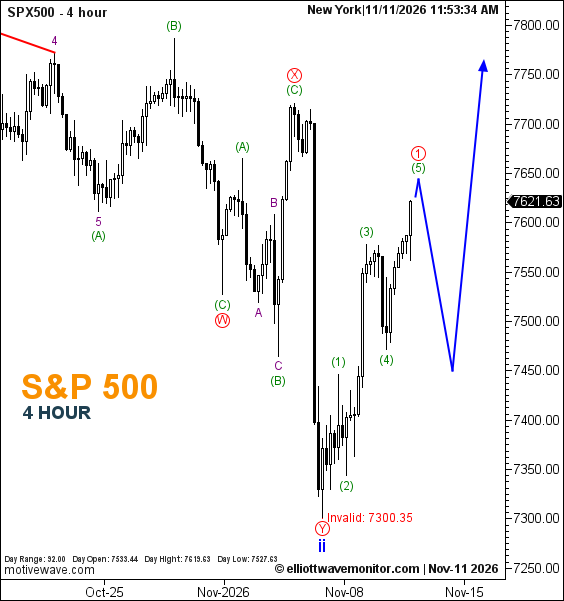
- The S&P 500 chart projects a rise, a corrective pullback, and a further advance; its current invalidation is 7,300.35.
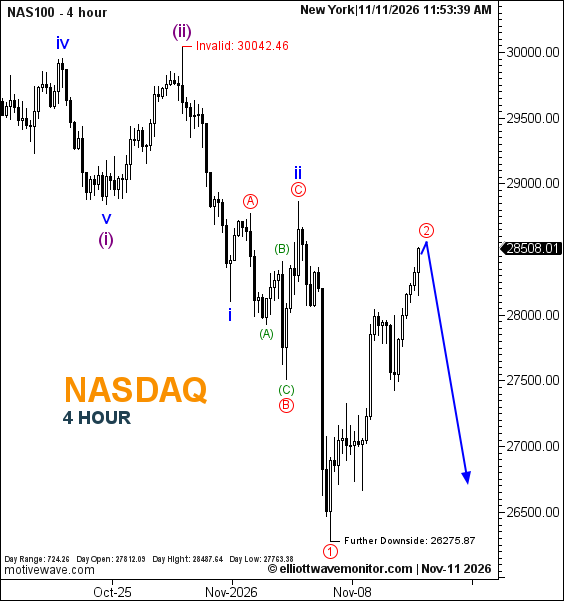
- Nasdaq’s blue path allows another corrective rebound before a potential decline toward 26,275.87.
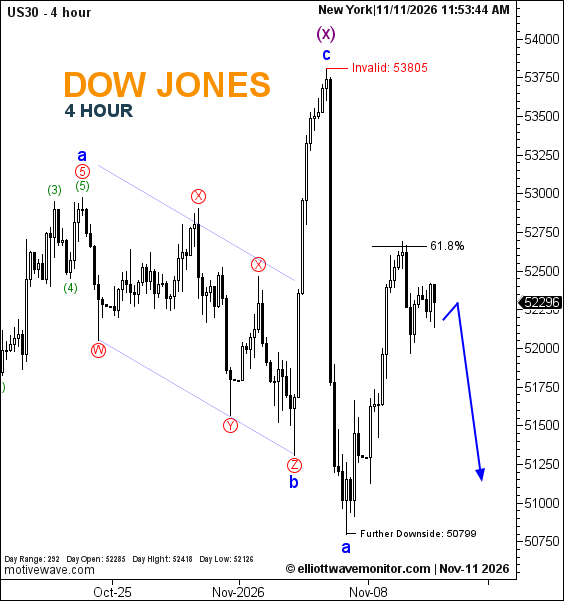
- Dow Jones retains a brief rebound-then-decline path, with 50,799 as the further-downside reference.
The November 11 four-hour charts show distinct projected paths for the three indices. The most notable update is on the S&P 500, where the current chart sketches a rising sequence interrupted by a pullback. The blue paths on Nasdaq and Dow Jones continue to allow for further downside; each scenario remains conditional.
The S&P 500 chart displays 7,621.63 at capture. Its green wave labels mark a rising sequence, while the blue projection shows a further rise, a corrective retreat, and another advance. The chart now marks 7,300.35 as invalidation, replacing 7,721.33 from the previous four-hour S&P 500 assessment. The projected path is not completed price action.
Nasdaq’s chart snapshot reads 28,508.01. Compared with the previous Nasdaq outlook, which projected a direct decline, the current blue path includes a further rebound toward the red circled wave 2 before a potential renewed drop. The chart keeps 30,042.46 as invalidation and 26,275.87 as the further-downside reference.
Dow Jones is shown at 52,296. The previous US30 analysis anticipated a limited recovery around the marked 61.8% Fibonacci line before renewed weakness. The new chart maintains a modest projected rebound followed by a possible decline. 53,805 is the marked invalidation level, while 50,799 remains the further-downside reference.
Trader’s question: Do the projected declines mean the next downward moves have already occurred?
Answer: No. The declines remain future paths on the charts. Each scenario depends on subsequent price action and its own invalidation level.