
Key Points
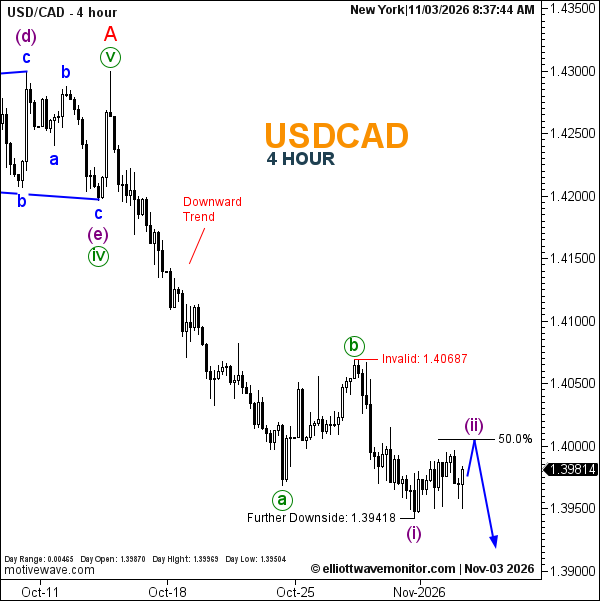
- USD/CAD approached the projected retracement area, reaching 1.39969 intraday.
- Purple wave (ii) remains the anticipated corrective phase.
- The broader bearish outlook holds, with invalidation at 1.40687.
USDCAD Rate: USD/CAD traded at 1.39814 at 8:37 a.m. New York time. The four-hour chart shows an opening rate of 1.39870, with a daily high of 1.39969 and low of 1.39504.
USDCAD Elliott Wave Analysis
The corrective recovery outlined in the November 2 USDCAD forecast has approached its anticipated Fibonacci region, without establishing a confirmed turning point.
The Elliott Wave count remains unchanged. Purple wave (i) is labeled at the preceding trough, while wave (ii) is projected toward the 50% retracement near 1.4000.
Although the latest advance supports the corrective scenario, the blue path subsequently favors renewed selling. Confirmation of that bearish extension requires actual price development rather than proximity to Fibonacci alone.
Technical Analysis for November 3, 2026
- Trend: Bearish, with a corrective rebound.
- Wave Structure: Purple (ii) projected.
- Fibonacci: 50% retracement near 1.4000.
- Downside Reference: 1.39418.
- Invalidation: 1.40687.
Trader's Question: Would a break below 1.39418 confirm further weakness?
It would establish a move beneath the marked reference, strengthening the bearish case. However, the projected decline has not yet occurred.