
Key Points
- USD/JPY advanced to 158.305, narrowly below its bearish invalidation threshold.
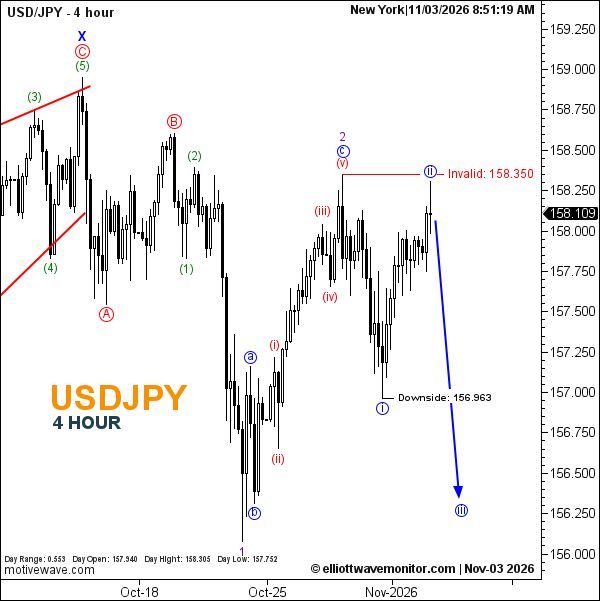
- The latest Elliott Wave count places blue wave ii at the recent recovery high.
- A projected third-wave decline could extend beneath the earlier 156.963 low.
USDJPY Rate: USD/JPY traded at 158.109 at 8:51 a.m. New York time. The four-hour chart records a daily high of 158.305 and low of 157.752, against an opening rate of 157.940.
USDJPY Elliott Wave Analysis
USD/JPY's recovery has approached a critical technical boundary, placing additional pressure on the bearish scenario outlined in the November 2 dollar-yen outlook.
The updated count retains purple wave 2 at the preceding corrective peak and positions blue wave ii at the latest rebound high.
Although the recovery has approached 158.350, the marked invalidation remains intact. The projected blue wave iii subsequently favors another downward extension, initially confronting the historical 156.963 reference before potentially establishing lower levels.
This bearish continuation remains conditional on subsequent price action.
Technical Analysis for November 3, 2026
- Trend: Bearish scenario under pressure.
- Wave Structure: Blue ii provisionally complete; iii projected.
- Downside Reference: 156.963.
- Invalidation: 158.350.
- Next Expected Move: Renewed bearish extension.
Trader's Question: Does an initial decline from the latest high confirm wave iii?
Not independently. A sustained downward sequence consistent with the proposed wave count would provide stronger evidence than a single reversal candle.