
Key Points
- Bitcoin breached the former $75,625 invalidation threshold, overturning the earlier recovery count.
- Red wave B is now labeled at $73,444.3 within a revised corrective structure.
- A rebound toward the 50% Fibonacci retracement could precede another decline.
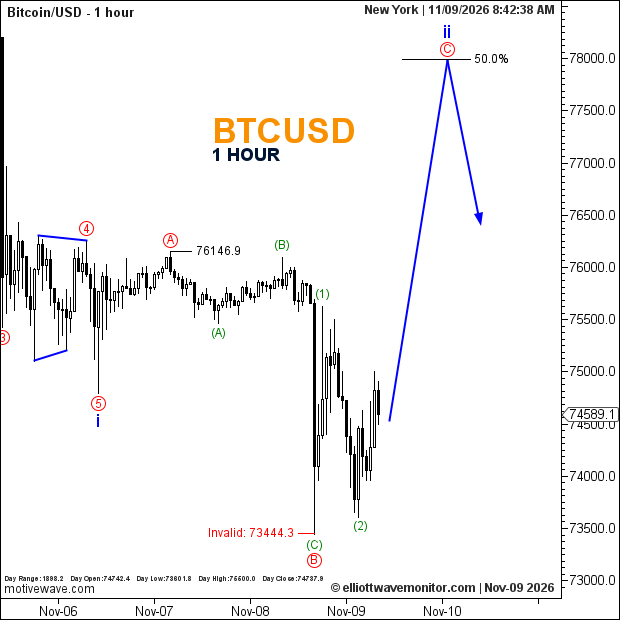
Bitcoin Price: BTCUSD traded at $74,589.1 at 8:42 a.m. New York time. The hourly chart displays a daily opening price of $74,742.4 and a session low of $73,601.8.
Bitcoin Elliott Wave Analysis
Bitcoin's decline below $75,625 has invalidated the provisional wave B completion underpinning the November 4 Bitcoin outlook, requiring a substantial reassessment of the anticipated recovery.
The revised Elliott Wave count identifies blue wave i at the earlier five-wave decline. Red wave A subsequently reached $76,146.9, before wave B extended to a lower structural trough.
The projected path now anticipates red wave C advancing toward the 50% Fibonacci retracement near $78,000, potentially completing blue wave ii. Another bearish extension is favored afterward, although neither projected movement is confirmed.
Technical Analysis for November 9, 2026
- Structure: Blue i labeled; blue ii projected.
- Current Count: Red A and B labeled; C anticipated.
- Fibonacci: 50% retracement near $78,000.
- Invalidation: $73,444.3.
Trader's Question: Would a recovery toward $78,000 confirm a bullish reversal?
Not under the current count. The anticipated rise is classified as a second-wave correction, with the broader outlook still allowing renewed downside.