
Key Points
- Bitcoin extended its decline to $75,625, moving beneath the previous downside reference.
- The updated Elliott Wave count identifies a potential completion of the larger red wave B.
- A temporary pullback could precede further upside, with $75,625 marking invalidation.
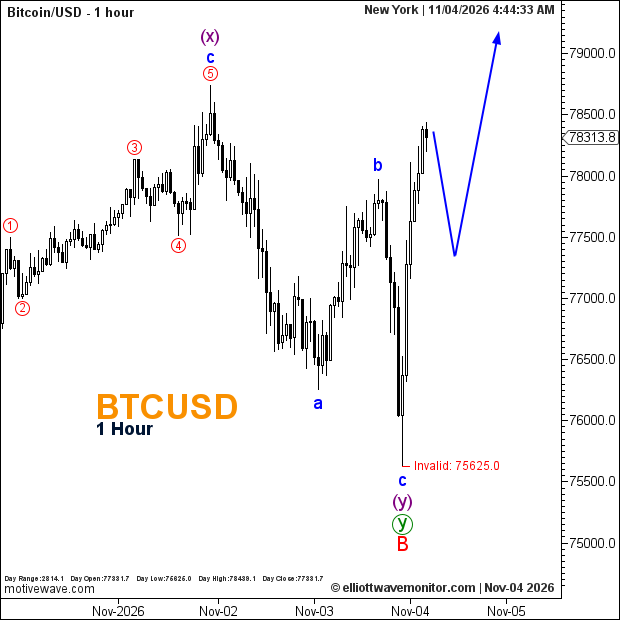
Bitcoin Price: BTCUSD traded at $78,313.8 at 4:44 a.m. New York time. The hourly chart shows a daily high of $78,438.1 and low of $76,826.0.
Bitcoin Elliott Wave Analysis
Bitcoin's decline has fulfilled the bearish continuation anticipated in the November 3 New York session forecast, before giving way to a substantial recovery.
The updated count places blue wave c, purple wave (y), green wave y and red wave B at the $75,625 trough. This convergence suggests the broader corrective decline may have concluded, shifting the near-term outlook toward recovery.
The blue projection anticipates an initial retracement followed by another upward extension. However, the potential advance remains conditional, with no exact upside target established.
Technical Analysis for November 4, 2026
- Wave Structure: Red B provisionally complete.
- Structural Low: $75,625.
- Projected Path: Temporary pullback followed by further upside.
- Invalidation: $75,625.
Trader's Question: Does the rebound confirm a sustained bullish reversal?
Not yet. The revised count supports a recovery scenario, but subsequent price action must validate the proposed continuation without breaching the marked invalidation.