
Key Points
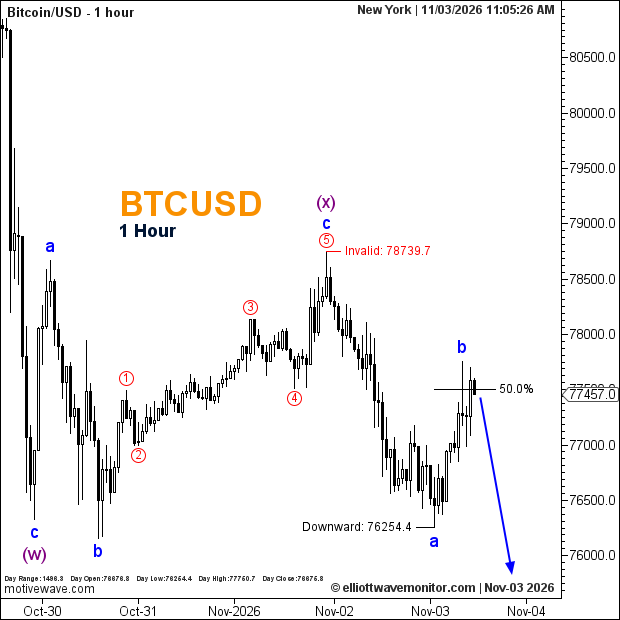
- The rebound reached the marked 50% Fibonacci level.
- The chart labels blue wave b near the recovery peak.
- A renewed decline is projected; 78,739.7 remains the marked invalidation.
BTCUSD Rate: Bitcoin was quoted at 77,457.0 at 11:05 a.m. New York time.
Bitcoin Analysis
The latest chart advances the sequence described in the London-session BTCUSD outlook: blue wave b was expected to rebound toward the 50% retracement before a possible downward extension. The chart now marks blue b beside the rebound peak, with the latest quote at the 50% line and a blue arrow projecting lower. The quote is 805.2 above the earlier 76,651.8 snapshot, a difference between observations rather than a session return. The chart identifies 76,254.4 as a downside reference, while the arrow’s endpoint has no exact price label. The decline therefore remains projected, not confirmed as complete.
Technical Analysis for November 3, 2026
- Wave structure: Red 5, blue c and purple (x) at the earlier peak; blue a and b labeled.
- Fibonacci: 50% retracement at 77,457.0.
- Downside reference: 76,254.4.
- Invalidation: 78,739.7.
Trader’s Question: Does reaching the 50% retracement reverse the bearish outlook?
Answer: No. The chart treats the rebound as blue wave b and projects another decline. The marked invalidation remains 78,739.7.