
Key Points
- Bitcoin extended its decline to $61,970.3, establishing another wave low.
- The latest recovery brings a higher-degree corrective phase into focus.
- Renewed selling remains the projected path after the rebound.
Bitcoin Price
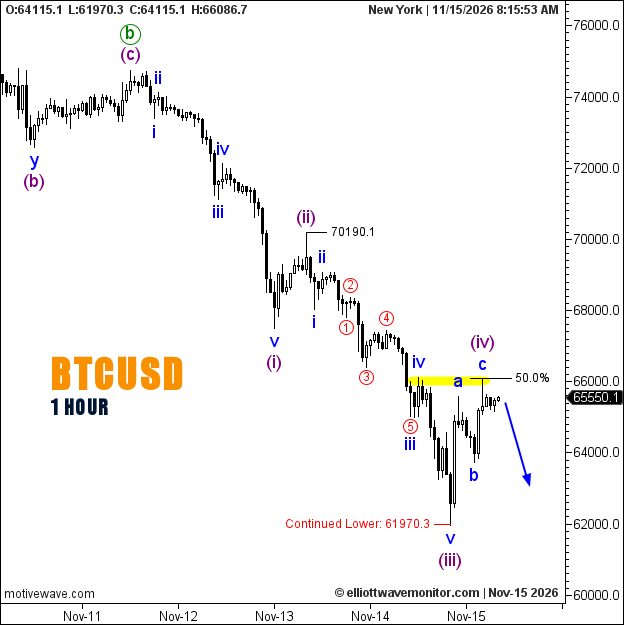
BTCUSD traded at $65,565.8 at 8:11 a.m. New York time, recovering from the latest marked low of $61,970.3 on the hourly chart.
Bitcoin Elliott Wave Analysis
The bearish sequence described in the November 14 Bitcoin price forecast has progressed through blue wave iv and a subsequent fifth-wave decline.
The new trough carries both blue wave v and purple wave (iii), indicating a potential transition into a larger corrective phase.
Bitcoin's rebound now places purple wave (iv) under examination, with the 50% Fibonacci retracement marking the relevant reference area. The blue projection nevertheless anticipates another downward extension.
The third-wave low remains provisional, and no explicit invalidation threshold is provided.
Technical Analysis — November 15, 2026
- Trend: Bearish, H1.
- Structure: Blue v at purple (iii).
- Latest Low: $61,970.3.
- Fibonacci: 50% corrective retracement.
- Outlook: Wave (iv) recovery, followed by potential downside.
Trader's Question: Does the recovery from $61,970 confirm a lasting bottom?
No. The current count treats the rebound as corrective. A sustained reversal would require stronger structural evidence than a recovery toward the Fibonacci reference alone.