
Key Points
- Bitcoin extended its bearish sequence to $67,500, below the previous structural low.
- Five blue subdivisions now mark a provisional completion of wave (i).
- A corrective recovery toward Fibonacci 38.2% could precede another decline.
Bitcoin Price
BTCUSD was quoted at $69,306 at 5:59 a.m. New York time, following a rebound from the chart-marked $67,500 trough.
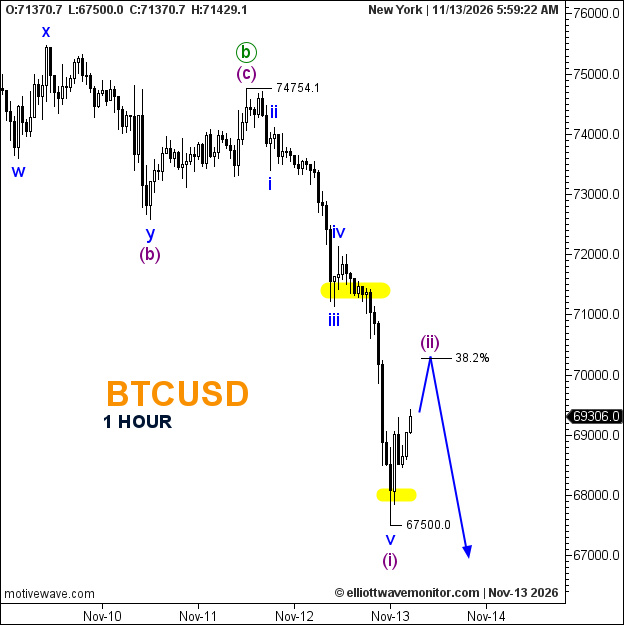
BTCUSD Elliott Wave Analysis
Bitcoin's decline has accelerated beyond the structure examined in the November 12 Bitcoin price analysis, when a fourth-wave rebound remained under consideration.
The updated chart now labels blue waves iv and v within the completed five-wave decline, with the larger blue wave (i) provisionally ending at the latest low.
Attention shifts toward purple wave (ii), whose projected recovery approaches the 38.2% Fibonacci retracement.
The blue forecast subsequently anticipates renewed selling. Neither the corrective peak nor the next bearish extension has been confirmed.
Technical Analysis for November 13, 2026
- Trend: Bearish.
- Wave Structure: Blue wave (i) provisionally complete.
- Next Wave: Purple (ii), corrective recovery.
- Fibonacci: 38.2% retracement.
- Downside Reference: $67,500.
Trader's Question: Would a rebound above $70,000 confirm a bullish reversal?
No. Under the current count, an advance would remain corrective unless subsequent price action establishes a different wave structure.