
Key Points
- Bitcoin invalidated its previous recovery scenario after falling below $73,444.3.
- The revised Elliott Wave count identifies a developing bearish sequence.
- A rebound toward Fibonacci 38.2% could precede further selling.
Bitcoin Price
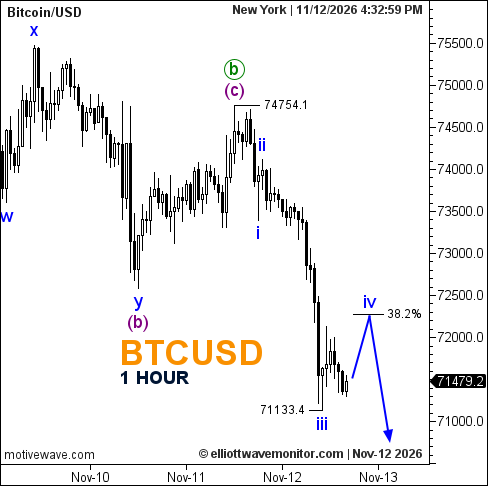
BTCUSD traded at $71,479.2 at 4:32 p.m. New York time. The hourly chart marks a recent low of $71,133.4, following a decline from the $74,754.1 wave peak.
Bitcoin Elliott Wave Analysis
Bitcoin's extended decline has overturned the corrective recovery anticipated in the November 10 technical outlook, where an advance toward $78,000 remained projected.
The updated count places purple wave (c) and green wave b at the preceding recovery high. Subsequent selling has developed through blue waves i, ii and iii, with the third wave provisionally labeled at the latest trough.
The blue projection now anticipates a wave iv rebound toward the 38.2% Fibonacci retracement, followed by another downward extension.
No new invalidation threshold has been specified.
Technical Analysis for November 12, 2026
- Scenario: Previous bullish correction invalidated.
- Structure: Blue wave iii provisionally complete.
- Next Wave: Blue iv, corrective rebound.
- Fibonacci: 38.2% retracement.
- Downside Reference: $71,133.4.
Trader's Question: Would a Fibonacci rebound confirm a bullish reversal?
No. The projected recovery represents a countertrend fourth-wave movement. A sustained directional change would require separate technical confirmation.