
Key Points
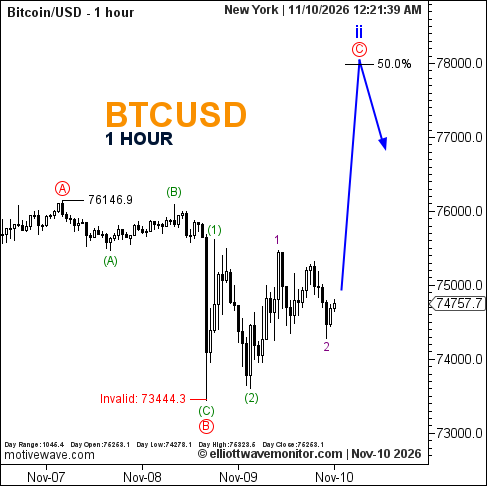
- BTCUSD has developed additional short-term wave subdivisions without changing its broader outlook.
- Purple waves 1 and 2 are now labeled within the recent price action.
- A recovery toward Fibonacci 50% remains projected before another potential decline.
Bitcoin Price: Bitcoin traded at $74,757.7 at 12:21 a.m. New York time, compared with $74,589.1 in the preceding chart snapshot. This difference does not represent an official daily price change.
Bitcoin Elliott Wave Analysis
Bitcoin's latest price action has added detail to the corrective recovery outlined in the November 9 New York session analysis, without establishing a decisive upward breakout.
The updated count identifies purple waves 1 and 2 on the hourly chart, offering preliminary evidence of an emerging short-term wave sequence.
The broader projection remains unchanged: red wave C could advance toward the 50% Fibonacci retracement near $78,000, potentially completing blue wave ii.
A subsequent bearish extension is anticipated, although neither the projected recovery target nor the following decline has been confirmed.
Technical Analysis for November 10, 2026
- Structure: Purple waves 1 and 2 labeled.
- Projected Wave: Red C within blue ii.
- Fibonacci: 50% retracement near $78,000.
- Invalidation: $73,444.3.
Trader's Question: Do the new wave labels confirm that Bitcoin's recovery is underway?
They provide preliminary structural evidence, but confirmation requires further upward price development. The projected Fibonacci objective remains untested.