
Dow Jones Rate: US30 fell to 51,576 on the four-hour chart at 8:49 AM New York time, down 302 points from the earlier 51,878 reading.
Dow Jones Outlook
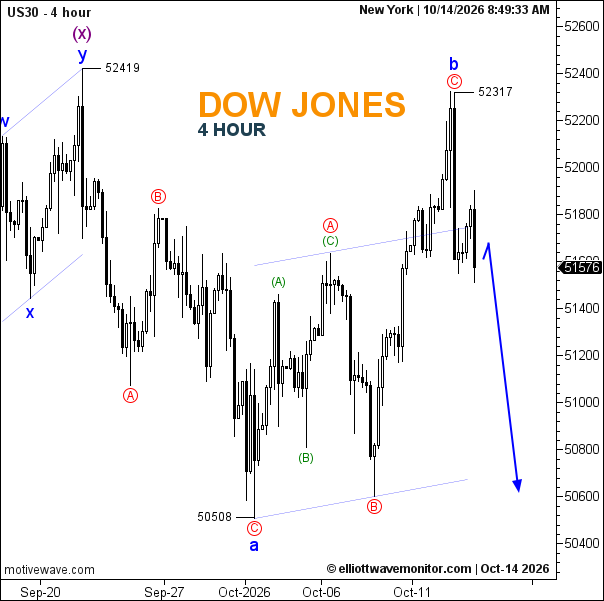
The decline strengthens the previous forecast that wave b may have ended at 52,317. The internal A–B–C recovery remains intact, while the latest selling pressure suggests wave c could be underway.
- Wave Structure: Potential bearish wave c.
- Trendline: Price is testing the former ascending channel boundary.
- Support: 51,500, 51,000, then 50,508. Resistance: 51,800 and 52,317.
A sustained break below 51,500 would reinforce the bearish outlook, exposing the 50,508 region. Recovery above 52,317 would invalidate the proposed completion of wave b.
Dow Jones News: September US CPI rose 3.7% annually versus 3.6% expected, while core inflation reached 2.6%. The upside surprise pressured stock futures and increased Fed tightening concerns.