
Key Points
- Ethereum has recorded a further decline to $1,890.36.
- The four-hour Elliott Wave structure indicates an advancing bearish impulse.
- A temporary wave 4 recovery may precede another downward move.
Ethereum Price
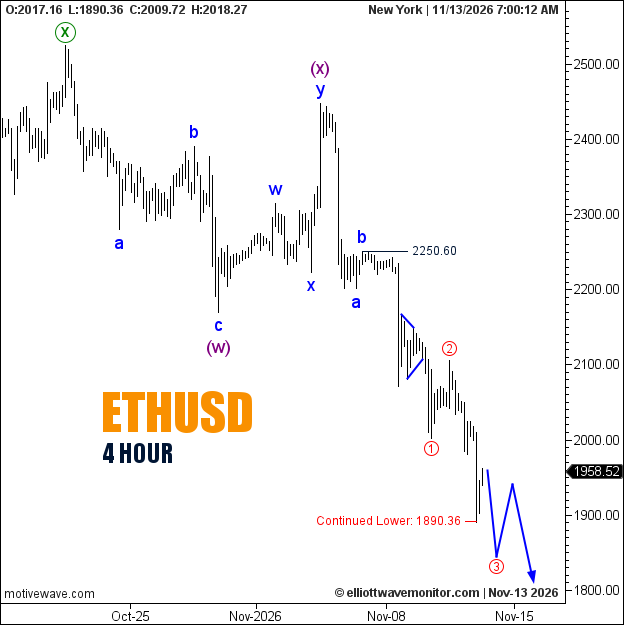
ETHUSD is quoted at $1,958.52 on the four-hour chart captured at 7:00 a.m. New York time, following a decline that established a new marked low at $1,890.36.
Ethereum Elliott Wave Analysis
Selling pressure has extended Ethereum's bearish structure, reinforcing the downside direction outlined in the November 9 Ethereum technical analysis.
The latest decline is labeled as part of red wave 3, following the corrective sequence marked w-x-y in blue. The chart now anticipates a countertrend recovery in red wave 4 before a prospective fifth-wave decline.
The $2,250.60 reference remains above the market, while the projected recovery has no explicitly defined price target. The anticipated final selloff is likewise conditional, not yet confirmed.
Technical Analysis — November 13, 2026
- Trend: Bearish.
- Wave Structure: Red wave 3, followed by projected waves 4 and 5.
- Recorded Low: $1,890.36.
- Upper Reference: $2,250.60.
Trader's Question: Would a recovery signal a bullish reversal?
Not necessarily. Under the current count, an advance would initially represent a corrective fourth wave. A structural reassessment would require stronger evidence than a temporary rebound.