
Key Points
- Ethereum's decline has extended toward $2,071, reinforcing the broader bearish outlook.
- The revised Elliott Wave count identifies a developing W–X–Y corrective structure.
- Further weakness remains projected, with invalidation lowered to $2,250.60.
Ethereum Price: ETH/USD traded at $2,121.88 at 9:01 a.m. New York time, below the chart's daily opening reading of $2,124.81. The displayed session low stands at $2,080.86.
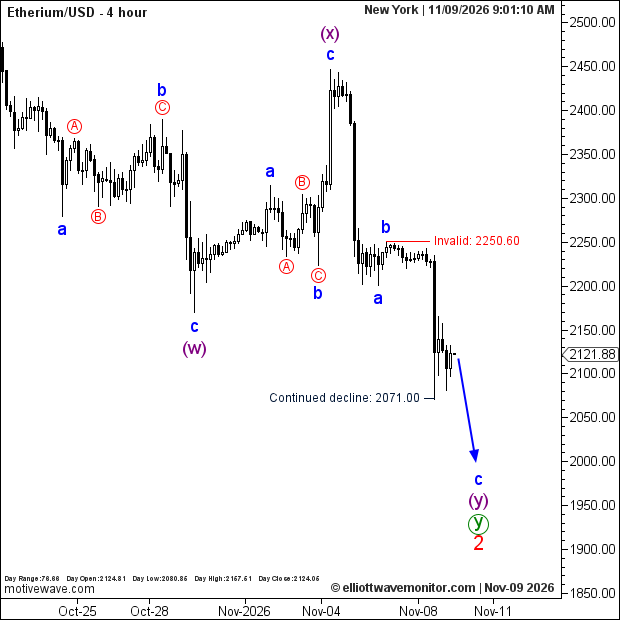
Ethereum Elliott Wave Analysis
Ethereum's decline has advanced substantially since the November 4 technical outlook, which anticipated renewed weakness following the purple wave (x) recovery.
Although the bearish direction has developed as projected, the updated chart adopts a more detailed corrective structure.
Blue waves a and b are now labeled following the wave (x) peak, while wave c remains projected downward. Its anticipated completion could also conclude purple wave (y), green wave y and the larger red wave 2.
The revised invalidation at $2,250.60 replaces the previous threshold of $2,523.20. No exact terminal downside objective is specified.
Technical Analysis for November 9, 2026
- Trend: Bearish.
- Wave Structure: Blue c projected within purple (y).
- Downside Reference: $2,071.00.
- Invalidation: $2,250.60.
Trader's Question: Does reaching $2,071 confirm the larger correction is complete?
No. The marked level documents an earlier decline, while the projected wave c extension remains unfinished and requires additional price development.