
Key Points
- Ethereum exceeded the former $2,389.40 invalidation level, requiring a revised Elliott Wave count.
- The updated structure identifies purple waves (w) and (x).
- Another bearish extension is projected following the corrective recovery.
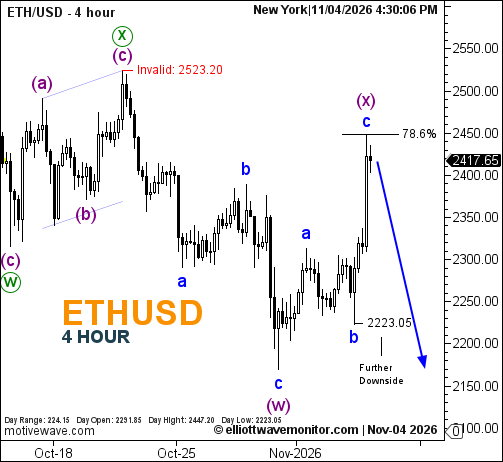
Ethereum Price: ETH/USD traded at $2,417.65 at 4:30 p.m. New York time. The four-hour chart records a daily high of $2,447.20 and low of $2,223.05, against an opening price of $2,291.85.
Ethereum Elliott Wave Analysis
Ethereum's recovery has breached the invalidation threshold established in the November 2 price forecast, invalidating the earlier wave interpretation despite the continuing possibility of downside.
The revised count identifies a three-wave decline completing purple wave (w), followed by a corrective a–b–c advance toward purple wave (x).
The latest recovery has approached the 78.6% Fibonacci retracement, where wave (x) is provisionally labeled.
The blue projection subsequently favors another downward extension, although the anticipated decline has not been confirmed.
Technical Analysis for November 4, 2026
- Structure: Purple (w) labeled; (x) provisionally complete.
- Fibonacci: 78.6% retracement.
- Invalidation: $2,523.20.
Trader's Question: Is $2,223.05 the next confirmed downside target?
No. It marks the previous blue wave b low. The chart projects renewed weakness without establishing a numerical objective for the next decline.