
Key Points
- Ethereum's corrective recovery has developed into the labeled green wave (2).
- The latest price structure suggests renewed bearish pressure.
- The projected decline targets $2,170.45, with invalidation at $2,389.40.
Ethereum Price
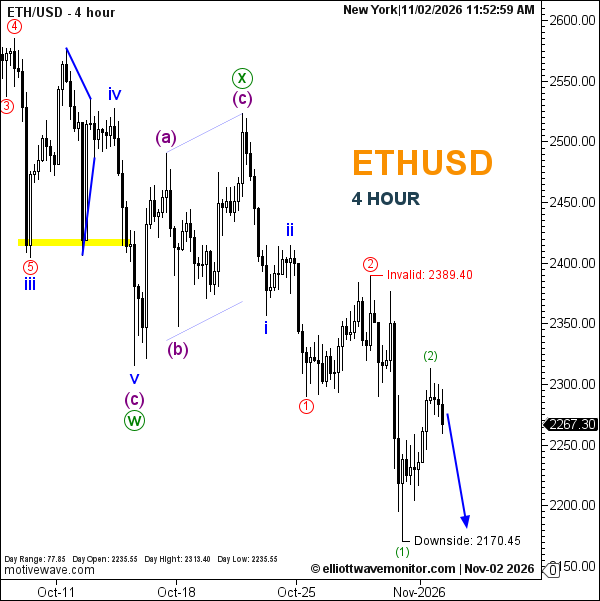
ETH/USD stood at $2,267.30 at 11:52 a.m. New York time. The four-hour chart shows a daily high of $2,313.40 and a low of $2,235.55, against an opening price of $2,235.55.
Ethereum Elliott Wave Analysis
Ethereum's corrective rebound has advanced beyond the stage anticipated in the October 30 Elliott Wave forecast, with green wave (2) now labeled on the updated chart.
The recovery followed the decline marked as green wave (1), but subsequent price weakness has returned attention to the prevailing bearish structure.
The blue projection now favors another downward extension toward $2,170.45. This remains a potential revisit of the previously identified downside reference, rather than confirmation of a fresh low.
Technical Analysis for November 2, 2026
- Trend: Bearish.
- Wave Structure: Green (2) provisionally labeled.
- Downside Target: $2,170.45.
- Invalidation: $2,389.40.
Trader's Question: Does the latest retreat confirm that wave (2) has ended?
Not conclusively. The updated count supports that interpretation, but further price development is needed before treating the projected bearish extension as established.