
Key Points
- GBP/USD exceeded its previous wave peak, reaching 1.34985.
- The revised Elliott Wave count keeps blue wave a in development.
- A 38.2% Fibonacci pullback could precede another upward extension.
British Pound Rate: GBP/USD traded at 1.34869 at 7:10 a.m. New York time. The four-hour chart records a daily high of 1.34985 and low of 1.34074, against an opening rate of 1.34141.
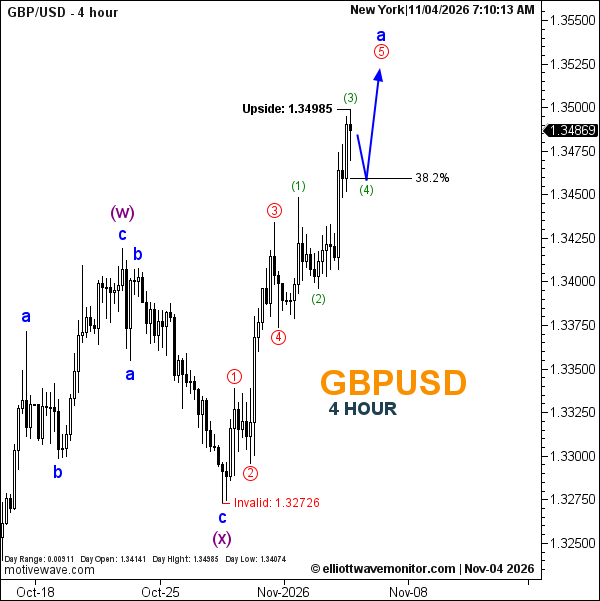
GBPUSD Elliott Wave Analysis
Sterling's latest advance has altered the corrective structure outlined in the November 3 GBPUSD outlook, which anticipated a blue wave b decline toward the 50% Fibonacci retracement.
Instead, the recovery extended to fresh highs, prompting a revision that places blue wave a's completion further ahead.
The updated count identifies green wave (3) near the latest peak. The projected path anticipates a green wave (4) retracement toward Fibonacci 38.2%, followed by another upward extension toward red wave 5 and blue wave a.
This sequence remains conditional, with no exact final upside objective established.
Technical Analysis for November 4, 2026
- Trend: Bullish corrective recovery.
- Wave Structure: Green (3) labeled; green (4) and red 5 projected.
- Fibonacci: 38.2% corrective retracement.
- Upside Reference: 1.34985.
- Invalidation: 1.32726.
Trader's Question: Would a deeper pullback than 38.2% invalidate the bullish outlook?
Not automatically. The retracement is a projected reference rather than a fixed boundary. The chart retains 1.32726 as the scenario's explicit invalidation level.