
Key Points
- Sterling remains below its established 1.34483 wave peak.
- The anticipated 50% Fibonacci correction has not yet been confirmed.
- The Elliott Wave structure continues to favor another advance following blue wave b.
British Pound Rate: GBP/USD traded at 1.34174 at 8:18 a.m. New York time. The four-hour chart records a daily high of 1.34264 and low of 1.33961, against an opening rate of 1.34065.
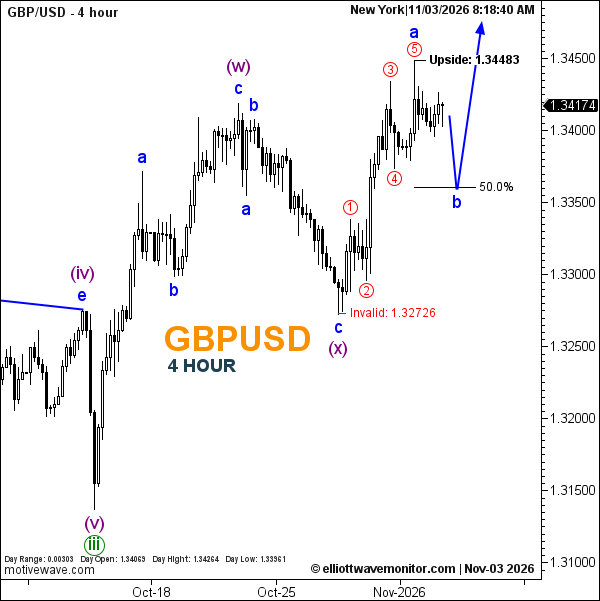
GBPUSD Elliott Wave Analysis
Sterling's latest price structure remains broadly consistent with the November 2 Elliott Wave analysis, which anticipated a corrective decline before another upward extension.
The updated chart retains blue wave a at the preceding five-wave recovery peak. Price has yet to establish a confirmed wave b low, leaving the projected 50% Fibonacci retracement as the next structural reference.
The blue path subsequently favors renewed appreciation, although no exact final upside objective is specified. With the principal wave labels unchanged, the focus remains on whether the proposed correction develops as anticipated.
Technical Analysis for November 3, 2026
- Trend: Corrective recovery; pullback projected.
- Wave Structure: Blue a labeled; blue b anticipated.
- Upside Reference: 1.34483.
- Fibonacci: 50% retracement projected.
- Invalidation: 1.32726.
Trader's Question: Has wave b begun simply because sterling trades below its previous peak?
Not conclusively. A lower quote alone cannot establish the corrective wave structure. Additional price development is needed to validate the proposed retracement.