
Key Points
- GBP/USD exceeded the previously identified 1.34340 upside reference.
- The updated Elliott Wave count places blue wave a at the latest high.
- A 50% Fibonacci retracement could precede another upward extension.
British Pound Rate
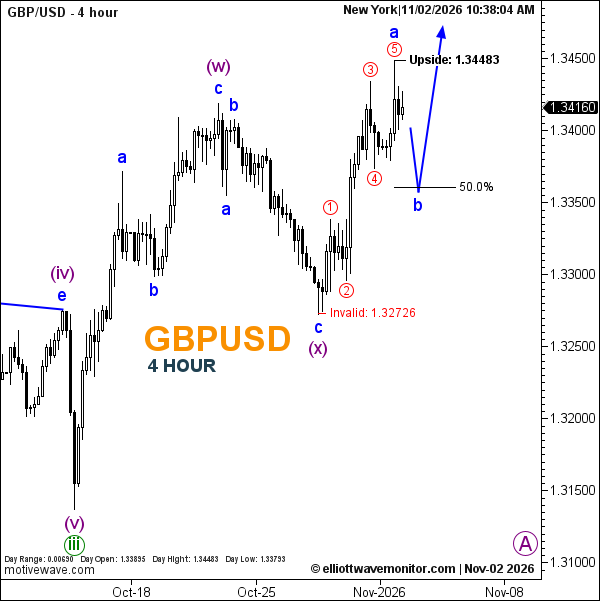
GBP/USD traded at 1.34160 at 10:38 a.m. New York time. The four-hour chart shows an intraday range between 1.33793 and 1.34483, against an opening price of 1.33895.
GBPUSD Elliott Wave Analysis
Sterling has advanced beyond the upper reference identified in the October 30 forex outlook, extending the recovery that followed the purple wave (x) low.
The updated structure identifies five red subdivisions culminating in blue wave a near the latest peak. This suggests the initial upward sequence may have concluded, shifting attention toward the next corrective phase.
The projected blue path anticipates a decline into wave b near the 50% Fibonacci retracement, followed by renewed appreciation. The subsequent advance remains prospective, with no exact final upside target specified.
Technical Analysis for November 2, 2026
- Trend: Bullish recovery; corrective pullback projected.
- Wave Structure: Blue a provisionally complete; blue b expected.
- Upside Reference Reached: 1.34483.
- Fibonacci Retracement: 50%, projected for wave b.
- Invalidation: 1.32726.
Trader's Question: Would a decline toward the 50% retracement invalidate the recovery?
No. That pullback is already incorporated into the projected wave structure. The marked invalidation remains at 1.32726.