
Nasdaq Rate: NAS100 stood at 30,374.88 on the four-hour chart at 9:00 AM New York time, extending its decline from 31,400.63.
Nasdaq Elliott Wave Analysis
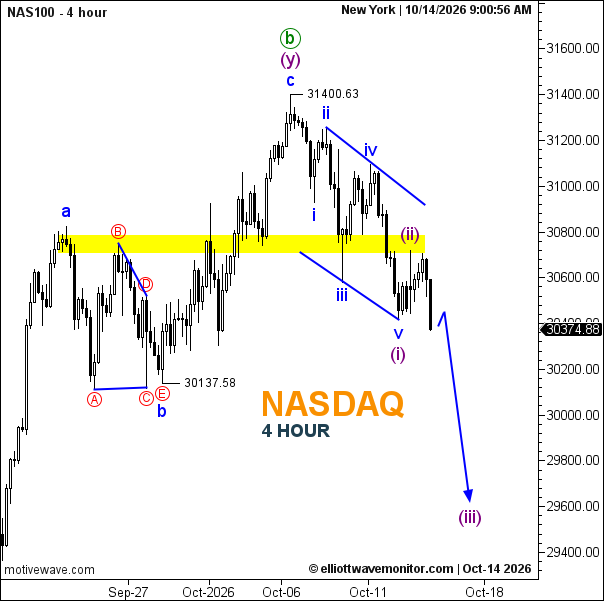
Wave b appears complete at 31,400.63, with wave c unfolding downward. The first five-wave decline suggests wave (i) has ended, while the rebound toward 30,700 marked wave (ii).
- Wave Structure: Bearish impulse within wave c.
- Trendline: Descending channel.
- Support: 30,137.58, then 30,000 and 29,600.
- Resistance: 30,700–30,800, then 31,400.63.
A brief rebound remains possible before wave (iii) extends toward 29,600. Sustained recovery above 30,800 would weaken the immediate bearish setup; exceeding 31,400.63 would invalidate the proposed wave (ii) count.
Nasdaq News: Semiconductor shares faced selling pressure amid AI investment concerns. September US CPI and ASML earnings remain key market catalysts, influencing Fed expectations and technology-sector sentiment.