
S&P 500 Rate: SPX500 stood at 7,778.49 on the four-hour chart at 9:01 AM New York time, retreating from recent highs near 7,843.89.
S&P 500 Elliott Wave Analysis
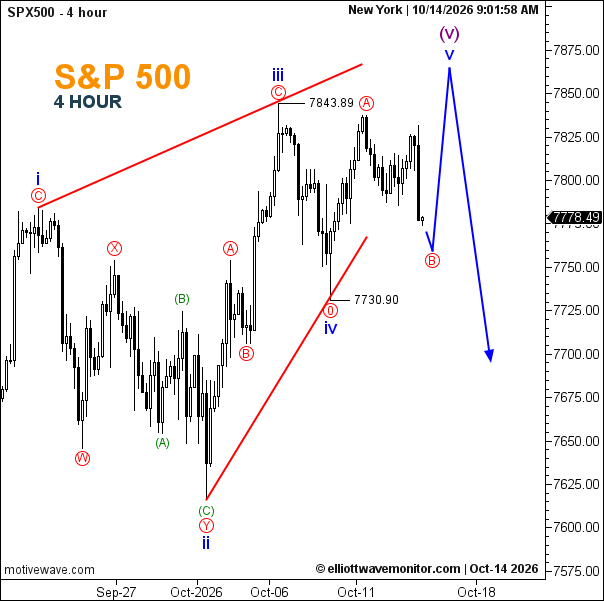
The previous bullish projection remains conditional. Wave iii peaked at 7,843.89, followed by wave iv at 7,730.90. The latest structure suggests wave v is developing an A–B–C correction before a potential final advance.
- Wave Structure: Bullish wave v approaching completion.
- Trendline: Rising, with weakening short-term momentum.
- Support: 7,750, then 7,730.90. Resistance: 7,843.89, then 7,860–7,875.
A rebound from the projected B-wave area could complete wave v near 7,860. Breaking below 7,730.90 would challenge the immediate bullish count.
S&P 500 News: September US CPI rose 3.7% annually, exceeding the 3.6% forecast. S&P 500 futures weakened as Treasury yields climbed. The Fed’s Beige Book is scheduled for 2 PM ET.