
- US inflation accelerated to 3.7% in September, strengthening the dollar and raising expectations of tighter Federal Reserve policy.
-
GBP/USD, EUR/USD and AUD/USD show bearish Elliott Wave structures, with additional downside possible if key supports fail.
-
USD/JPY may be completing an ending diagonal, while USD/CAD could undergo a corrective pullback before its broader uptrend resumes.
Forex Market News: US Inflation Shock Reshapes Currency Expectations
The US dollar strengthened on Wednesday, October 14, after hotter-than-expected September inflation data prompted markets to reconsider the Federal Reserve's interest-rate outlook.
Headline consumer prices rose 0.6% month over month and 3.7% annually, exceeding the 3.6% consensus forecast. Core inflation increased 0.3% monthly and 2.6% annually.
The dollar index advanced as US Treasury yields climbed, adding pressure to major currencies.
Sterling also faced uncertainty surrounding the UK's fiscal outlook, while the euro remained sensitive to French public-finance concerns. The Australian dollar had earlier benefited from stronger Chinese trade figures, but the inflation-driven dollar recovery challenged that momentum.
Against this backdrop, Elliott Wave Monitor's four-hour charts highlight five distinct technical scenarios.
GBP/USD Elliott Wave Analysis: Broken Support Signals Wave (iii)
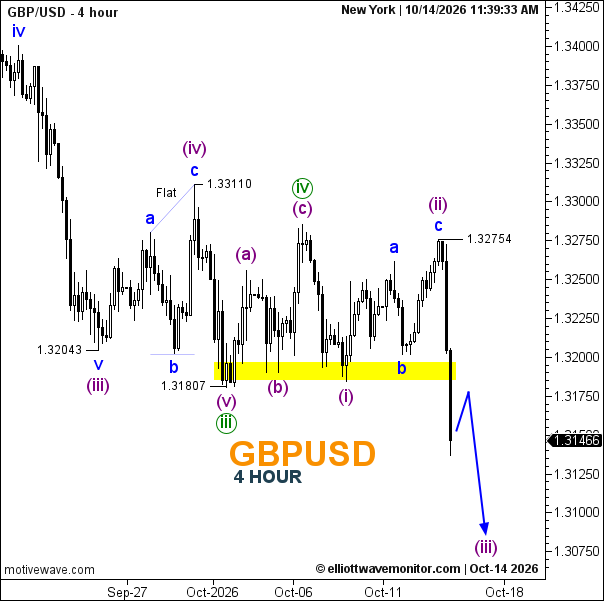
GBP/USD previously completed wave (iii) near 1.32043, followed by a flat correction in wave (iv), which peaked at 1.33110.
The subsequent decline completed wave (v), ending a larger wave iii. A corrective wave iv then developed through an A–B–C structure.
More recently, the pair established wave (i), followed by a three-wave rebound into wave (ii), with its final high at 1.32754.
The chart shows a sharp breakdown below the highlighted 1.3180–1.3200 support zone, with GBP/USD quoted at 1.31466.
This supports the possibility that bearish wave (iii) has begun.
The next downside region lies around 1.3100–1.3070. A sustained recovery above 1.32754 would invalidate the proposed immediate wave (iii) sequence.
EUR/USD Elliott Wave Analysis: Sellers Target Fresh Lows
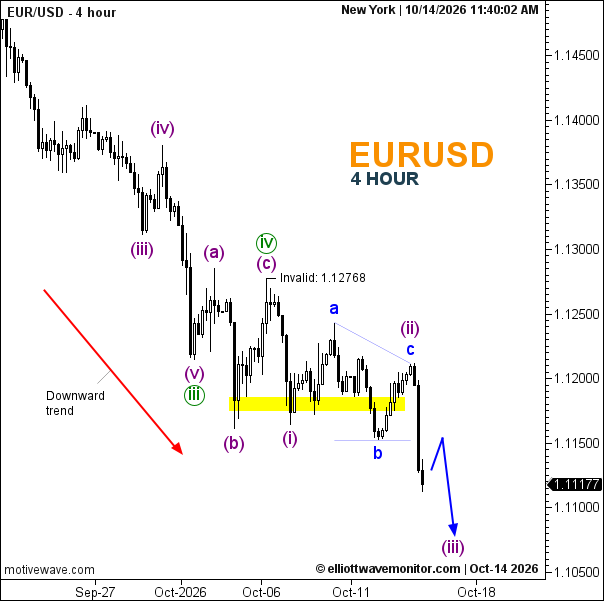
EUR/USD maintains a bearish four-hour structure after completing an earlier five-wave decline.
A corrective wave (iv) ended near 1.12768, which the chart identifies as the invalidation level for the subsequent bearish count.
Wave (i) then developed downward, followed by a corrective A–B–C rebound into wave (ii).
The highlighted support area around 1.1170–1.1190 has now been breached on the supplied chart.
At 1.11177, the pair appears to be extending into wave (iii), with the projected path pointing toward approximately 1.1070.
A recovery above the broken support would weaken immediate downside momentum, while a sustained move beyond 1.12768 would invalidate the broader proposed bearish sequence.
AUD/USD Elliott Wave Analysis: Rising Wedge Breakdown Threatens 0.6910
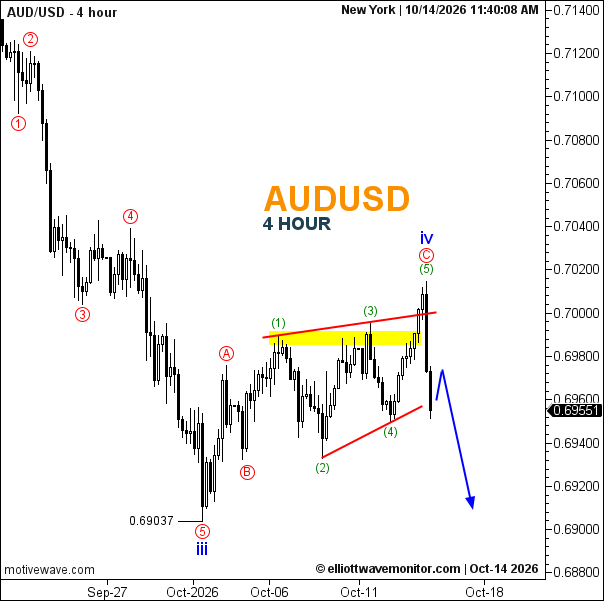
AUD/USD completed a larger third-wave decline at 0.69037 before developing a corrective recovery.
That rebound appears to have formed a rising wedge, with five internal subdivisions and a final wave iv peak near 0.7010–0.7020.
The price subsequently reversed sharply, breaking below the wedge's upper boundary and challenging its lower trendline.
At 0.69551, the bearish scenario anticipates a limited rebound before another decline toward 0.6910–0.69037.
A sustained move back above 0.7000 would weaken the immediate bearish interpretation, while a break above the recent wedge high would require reassessment of the corrective pattern.
USD/JPY Elliott Wave Analysis: Ending Diagonal Warns of Yen Recovery
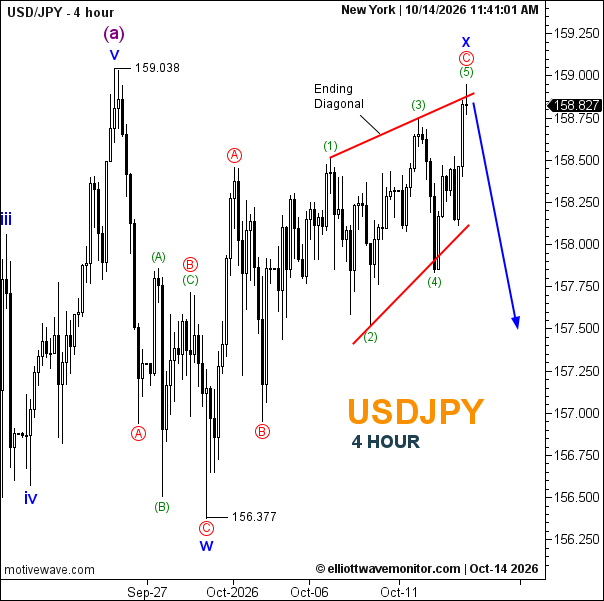
USD/JPY recovered from the 156.377 low in a complex corrective advance, with the latest segment forming an ending diagonal.
The five-wave diagonal appears to be approaching completion near 158.827, beneath the earlier reference high at 159.038.
This pattern often appears near the termination of a corrective movement and can precede a sharp reversal.
The projected decline initially targets the 158.00 area, followed by approximately 157.50.
A sustained break below the diagonal's lower boundary would strengthen the bearish reversal case. Continued trading above the recent diagonal high would delay the anticipated reversal.
USD/CAD Elliott Wave Analysis: Wave iv Correction Before Bullish Continuation
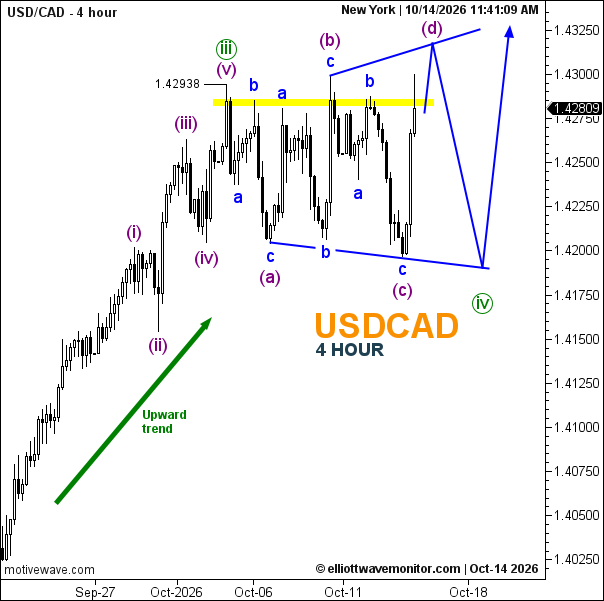
USD/CAD remains structurally different from the other pairs.
An earlier impulsive rally completed wave iii near 1.42938, followed by a broadening corrective structure labeled wave iv.
The correction contains alternating swings, with its upper boundary approaching 1.4320 and its lower boundary near 1.4190.
At 1.42809, the chart anticipates a possible final wave (d) advance toward the upper boundary, followed by a decline toward 1.4190 to complete wave (e).
Once the correction is complete, the broader bullish trend could resume above 1.4320.
A sustained breakdown beneath the corrective structure would challenge the expected bullish continuation.
Forex Outlook: Dollar Strength Meets Elliott Wave Reversal Risk
The five charts suggest that dollar strength may continue against sterling, the euro and the Australian dollar in the near term.
However, USD/JPY could reverse lower as its ending diagonal completes, while USD/CAD may require one more corrective decline before advancing.
The inflation-driven shift in US interest-rate expectations increases the importance of price confirmation and invalidation levels across all five pairs.