Key Points
- USOilSpot has rebounded from its marked support area.
- Green wave ii is provisionally complete following the earlier wave i advance.
- A Fibonacci 161.8% extension remains the projected objective for wave iii.
Crude Oil Price
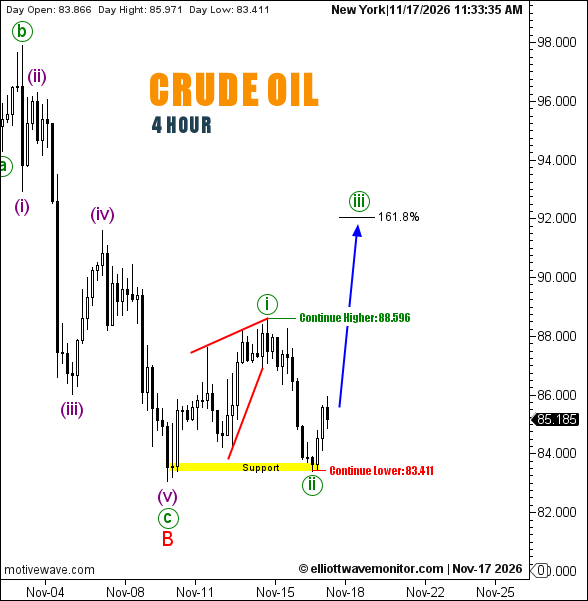
USOilSpot stood at $85.185 at 11:33 a.m. New York time, above its daily opening of $83.866. The four-hour chart recorded a high of $85.971 and a low of $83.411.
Crude Oil Elliott Wave Analysis
The recovery anticipated in EWM's November 13 crude oil assessment has developed a clearer internal structure, rather than progressing uninterrupted.
The latest count identifies green wave i following the provisional red B low, with the subsequent decline forming wave ii near the yellow support zone.
Although prices have recovered from that area, the anticipated third-wave advance remains unconfirmed.
The blue projection points toward the 161.8% Fibonacci extension near $92. The updated upside-continuation reference stands at $88.596, while a break below $83.411 would weaken the immediate recovery scenario.
Technical Analysis — November 17, 2026
- Trend: Corrective recovery, H4.
- Structure: Green ii provisionally complete; iii projected.
- Support: Yellow zone near $83.411.
- Upside continuation: $88.596.
- Target: Fibonacci 161.8%, approximately $92.
Trader's Question: Would a break below $83.411 formally invalidate the bullish wave count?
Not necessarily. The chart designates that level for downside continuation, not formal invalidation. A breach would challenge the immediate recovery interpretation and require reassessment.