Key Points
- AUDUSD and EURUSD: Both four-hour charts retain bearish projections, although corrective rebounds may interrupt further declines.
- GBPUSD: The latest wave count places the end of its corrective decline at the recent low, with a recovery projected but not confirmed.
- USDJPY and USDCAD: Their respective bullish structures anticipate corrective pullbacks before potential renewed advances.
The November 16 forex outlook reveals a significant structural development in the Australian dollar, a potentially completed correction in sterling, and continuing downward progression in the euro. The dollar-yen and dollar-Canadian dollar charts remain at different stages of their individual bullish scenarios, with both awaiting further corrective movement.
All five assessments are based on four-hour charts captured between 12:23 and 12:26 p.m. New York time, rather than independently verified live market quotations.
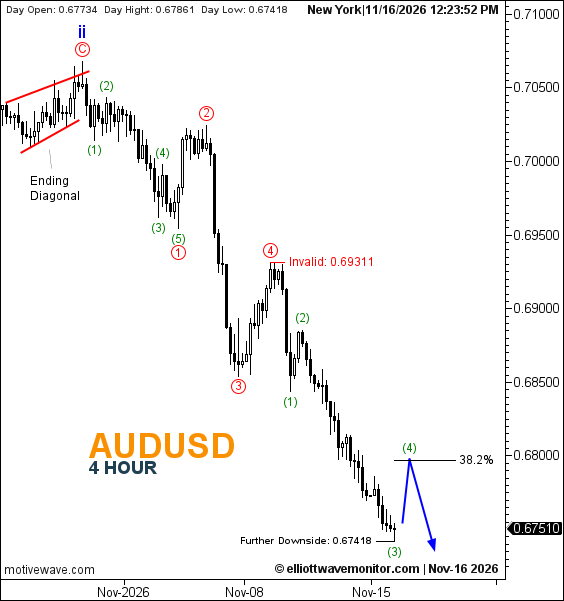
The most pronounced structural progression appears in AUDUSD, where the decline discussed in the November 13 Australian dollar forecast has moved beyond the previously developing red wave 3. The current chart marks red wave 4 at the intervening rebound high, followed by a renewed decline subdivided into green waves (1), (2), and (3).
At 12:23:52 p.m., AUDUSD displayed 0.67510, with a recorded daily low of 0.67418. The projected blue path anticipates a green wave (4) rebound toward the 38.2% Fibonacci retracement, followed by another decline. The chart identifies 0.69311 as invalidation and 0.67418 as Further Downside. The latter is also the recorded daily low, not a separately confirmed future target.
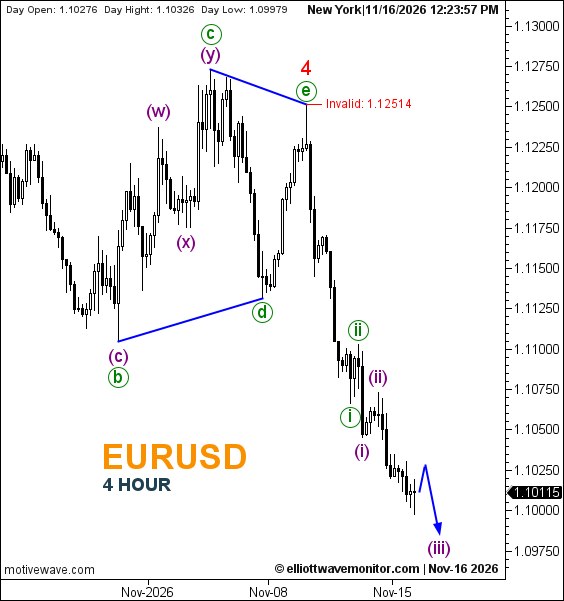
The bearish development in EURUSD has likewise progressed since the November 13 technical assessment, which identified green waves i and ii within the downward structure. The latest chart adds purple subdivisions (i) and (ii), while the anticipated (iii) remains positioned along the future declining path.
The chart displayed 1.10115 at 12:23:57 p.m., after recording a daily low of 1.09979. Its connected blue projection allows a limited upward correction before further downside. The bearish scenario retains 1.12514 as its explicit invalidation level, with no numerical endpoint specified for the projected decline.
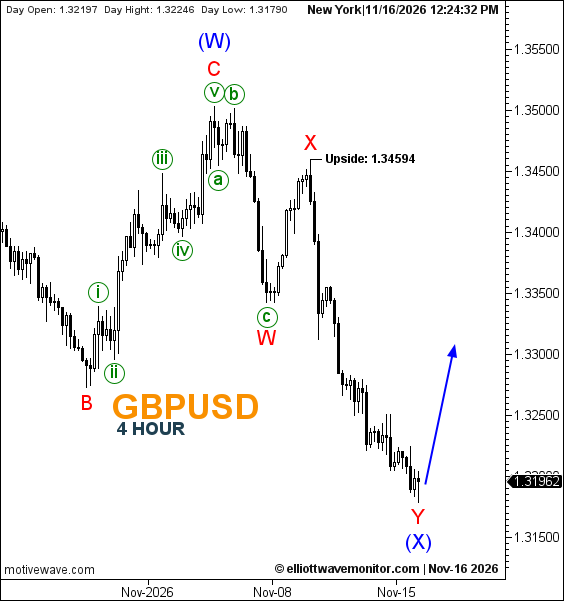
A different technical development is visible in GBPUSD. In the preceding sterling analysis, red wave Y was approaching a deeper Fibonacci retracement within blue wave (X). The new chart now places red wave Y and blue wave (X) at the latest low, suggesting a possible conclusion to the corrective sequence.
Sterling displayed 1.31962 at 12:24:32 p.m., while the day's recorded low stood at 1.31790. The blue arrow projects an upward recovery directly from the recent price structure, but the chart does not yet confirm a sustained reversal. 1.34594, labeled Upside, remains an upper reference rather than a confirmed destination or an invalidation boundary.
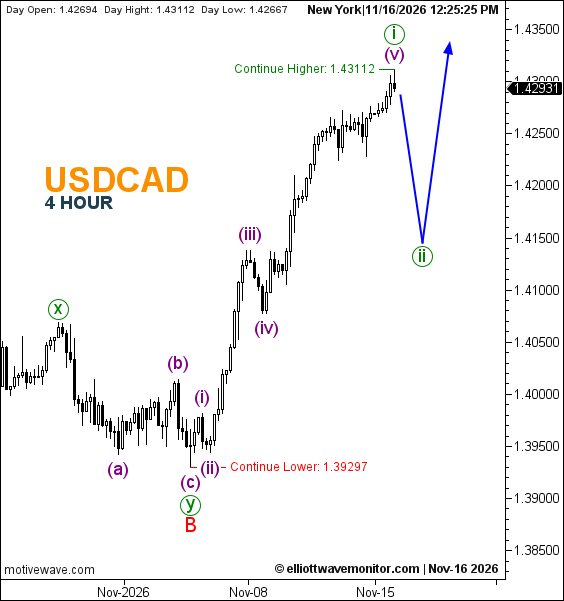
In USDCAD, the advance has extended beyond the upper reference documented in the November 13 combined forex report. The previous 1.42720 Continue Higher level has been surpassed, and the chart now places green wave i at a higher peak, alongside purple wave (v).
The latest snapshot showed 1.42931 at 12:25:25 p.m., following a daily high of 1.43112. That high is also the newly designated Continue Higher reference. The next projected movement remains a green wave ii decline before another potential advance. 1.39297 retains its Continue Lower designation; neither reference is explicitly labeled as invalidation.
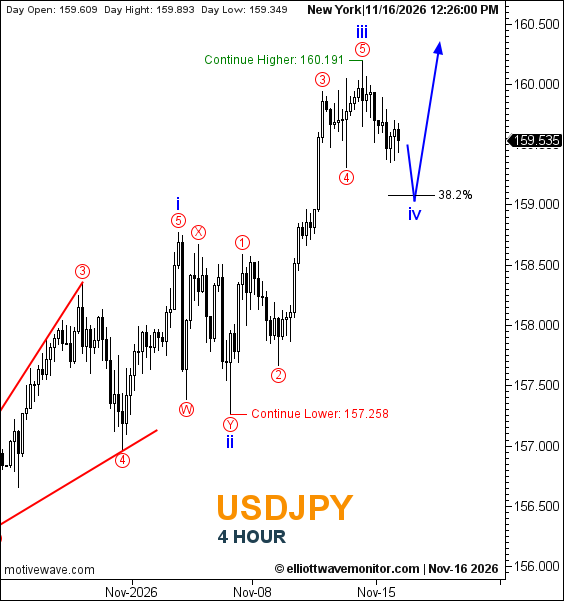
Finally, USDJPY has begun retreating from the previously labeled blue wave iii high. The correction anticipated in the November 13 dollar-yen outlook is developing, although the endpoint of blue wave iv remains prospective.
At 12:26:00 p.m., the chart displayed 159.535, compared with 159.779 in the previous snapshot. The forecast path first declines toward the 38.2% Fibonacci retracement before turning upward. The unchanged continuation references are 160.191 for further upside and 157.258 for further downside. Neither is marked as formal invalidation.
Technical Outlook — November 16, 2026
| AUDUSD | 0.67510 | Wave (4) rebound, then further decline | Invalid 0.69311; Further Downside 0.67418 |
| EURUSD | 1.10115 | Brief recovery, then wave (iii) decline | Invalid 1.12514 |
| GBPUSD | 1.31962 | Potential recovery after wave (X) | Upside 1.34594 |
| USDCAD | 1.42931 | Wave ii correction, then possible advance | Higher 1.43112; Lower 1.39297 |
| USDJPY | 159.535 | Wave iv retracement, then possible advance | Higher 160.191; Lower 157.258 |
Trader's Question: Do the anticipated corrective rebounds and pullbacks indicate confirmed trend reversals?
Answer: No. Each projected correction remains conditional on subsequent price action. A Fibonacci reference or labeled wave endpoint alone cannot establish that the next directional movement has begun.
This report is provided for general market information and education only and does not constitute investment advice.