
Key Points
- USD/CAD maintains its bearish structure, with purple wave (i) labeled at the latest low.
- A corrective recovery toward the 50% Fibonacci retracement is projected.
- The updated chart establishes 1.40687 as the scenario's invalidation level.
USDCAD Rate
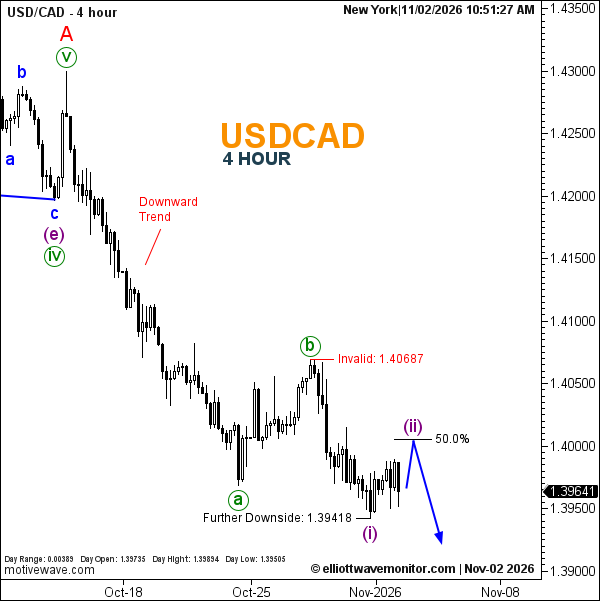
USD/CAD traded at 1.39641 at 10:51 a.m. New York time, against a daily opening rate of 1.39735. The four-hour chart records an intraday high of 1.39894 and low of 1.39505.
USDCAD Elliott Wave Analysis
The bearish sequence outlined in the October 30 forex outlook remains intact, with the earlier 1.39418 downside reference now positioned beside the latest wave-labeled low.
The updated count places green wave b at a preceding recovery peak and purple wave (i) at the subsequent trough, indicating a potential pause in the immediate decline.
The blue projection anticipates purple wave (ii) recovering toward approximately 1.4000, near the 50% Fibonacci retracement. A further bearish extension is subsequently expected, although neither projected movement is confirmed.
Technical Analysis for November 2, 2026
- Trend: Bearish.
- Wave Structure: Purple (i) labeled; purple (ii) projected.
- Fibonacci Retracement: 50%, around 1.4000.
- Downside Reference: 1.39418.
- Invalidation: 1.40687.
Trader's Question: Would an advance above 1.4000 invalidate the bearish scenario?
Not automatically. The 50% retracement is a projected reference, not a hard ceiling. The chart explicitly identifies 1.40687 as the invalidation boundary.