
Key Points
- Gold's updated count identifies blue waves a and b following the initial recovery.
- The proposed flat correction replaces the earlier zigzag interpretation but awaits structural validation.
- Blue wave c could extend the rebound toward purple wave (iv).
Gold Price: XAUUSD traded at $3,907.89 at 4:38 a.m. New York time. The hourly chart displays a session high of $3,964.64 and low of $3,895.52, against an opening price of $3,946.72.
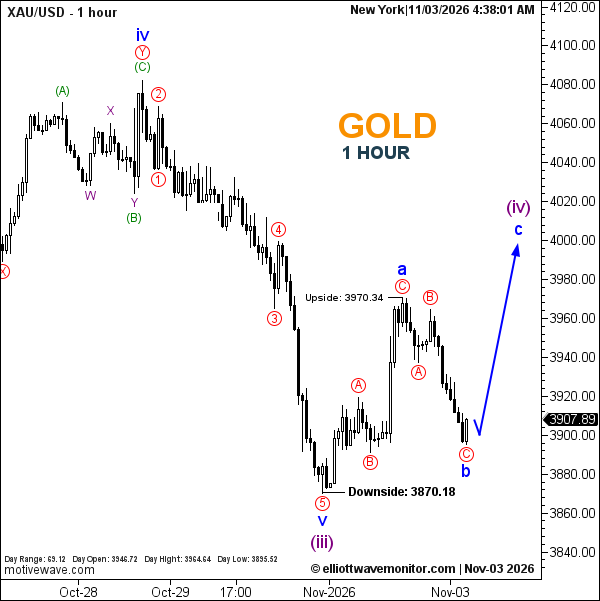
XAUUSD Elliott Wave Analysis
Gold's latest decline has prompted a reassessment of the corrective structure described in the November 2 Tokyo-session analysis.
Rather than extending the previous red-wave sequence, the updated count places blue wave a at the earlier recovery peak and identifies a subsequent A–B–C decline within blue wave b.
The analyst now favors a flat-family interpretation, although the observed retracement depth requires additional verification against conventional Elliott Wave criteria.
The projected blue wave c subsequently points toward purple wave (iv), near the $4,000 area. This remains a conditional forecast, not an established recovery.
Technical Analysis for November 3, 2026
- Structure: Blue a–b–c correction; flat classification provisional.
- Current Count: Blue b provisionally labeled.
- Next Wave: Blue c, upward projection.
- Upper Reference: $3,970.34.
Trader's Question: Is an A–B–C sequence sufficient to confirm a flat?
No. The proportions and internal subdivisions must also satisfy the pattern's requirements. Three labeled waves alone cannot establish the classification.