
Key Points
- Gold has established another low at $3,669.83.
- The corrective red wave ② is now provisionally complete.
- A limited rebound toward Fibonacci 50% may precede further selling.
Gold Price
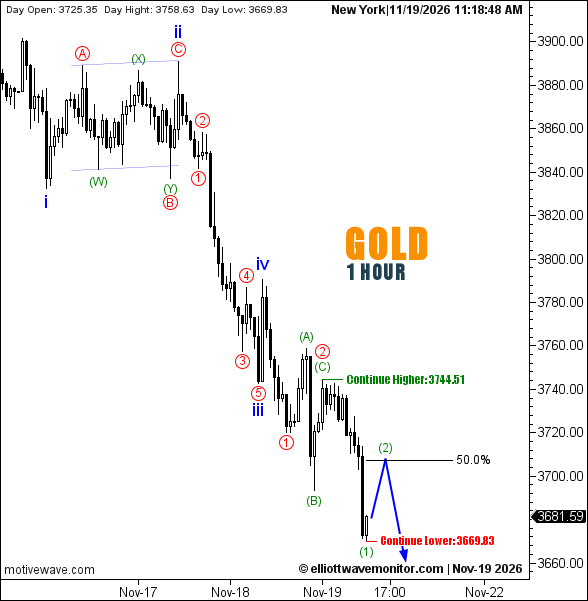
XAUUSD stood at $3,681.59 at 11:18 a.m. New York time, below its daily opening of $3,725.35. The hourly chart recorded a high of $3,758.63 and a low of $3,669.83.
Gold Elliott Wave Analysis
The temporary flat recovery anticipated in EWM's earlier November 19 gold forecast has been followed by renewed selling, pushing prices $23.75 beneath the previously established trough.
The updated count provisionally places red wave ② at the termination of green wave (C), with the subsequent decline establishing green wave (1) at the latest low.
The blue projection now anticipates a modest green wave (2) recovery toward the 50% Fibonacci retracement before bearish momentum potentially resumes.
This remains a corrective scenario rather than evidence of a sustainable reversal.
Technical Analysis — November 19, 2026
- Trend: Bearish, H1.
- Structure: Red ② provisionally complete; green (2) projected.
- Fibonacci: 50% retracement.
- Upside continuation: $3,744.51.
- Downside continuation: Below $3,669.83.
Trader's Question: Would reaching Fibonacci 50% invalidate the bearish outlook?
No. That retracement is a potential second-wave objective. Reaching it would not independently invalidate the bearish count or confirm the next decline.