
Key Points
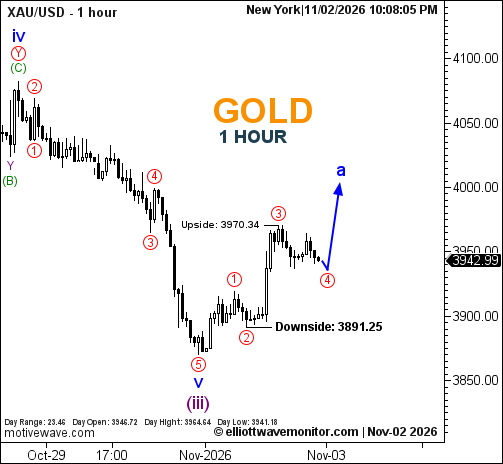
- Red wave 3 is now labeled at the latest recovery peak.
- A fourth-wave retracement is projected before the corrective advance resumes.
- Blue wave a remains unfinished, with further upside anticipated.
Gold Price
XAUUSD traded at $3,942.99 at 10:08 p.m. New York time. The hourly chart shows a daily high of $3,964.64 and low of $3,941.18, against an opening price of $3,946.72.
XAUUSD Elliott Wave Analysis
Gold's recovery has developed beyond the structure described in the earlier November 2 gold price analysis, with red wave 3 now positioned at an observed price peak rather than solely within the projected path.
The updated count suggests the third-wave advance may have concluded, shifting attention toward a potential wave 4 retracement.
The blue projection subsequently favors another upward extension to complete blue wave a, potentially approaching the $4,000 area. However, neither the projected fourth-wave low nor the final recovery target is numerically established.
Technical Analysis for November 2, 2026
- Trend: Corrective bullish recovery.
- Wave Structure: Red 3 provisionally complete; red 4 projected.
- Upside Reference: $3,970.34.
- Historical Downside Reference: $3,891.25.
Trader's Question: Does $3,970.34 represent a confirmed breakout threshold?
No. It is an annotated upside reference, not an explicitly designated confirmation trigger. The next wave development remains necessary to assess the recovery's continuation.