Bitcoin (BTC/USD) shows a cautiously bullish short-term outlook, with the displayed price at 80,585.77 following a rebound from 79,146.97. The Elliott Wave count identifies blue wave a near 80,928.16, followed by an A-B-C correction completing the proposed wave b near 79,997.81. Price has recovered toward the highlighted 80,500 area, while the ascending support line reinforces the potential continuation. The blue projection anticipates a brief consolidation before wave c advances toward approximately 81,800. A sustained break above 80,928.16 would strengthen bullish confirmation, whereas a decline below the annotated 79,997.81 invalidation level would undermine the proposed structure. The previous October 23 four-hour chart was bearish, but the different timeframe limits direct comparison.
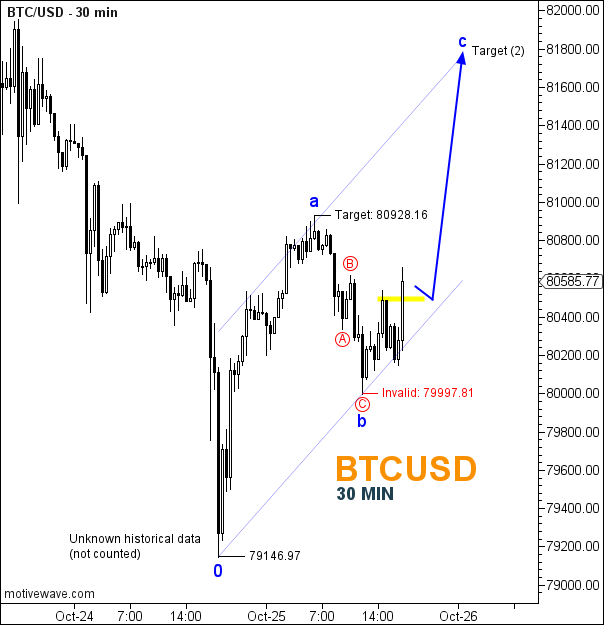
Technical Summary of Bitcoin Price for October 25, 2026
-
Trend: Bullish (short-term).
-
Current Elliott Wave: Blue wave b potentially completed; wave c projected upward.
-
Key Support Levels: 80,500 (approximate highlighted zone); 79,997.81 (invalidation).
-
Key Resistance Levels: 80,928.16 (annotated wave a target); 81,800 (projected).
-
Next Price Target: 80,928.16, followed by approximately 81,800.
-
Invalidation Level: 79,997.81 (annotated).
Trader's Question: Can Bitcoin confirm the start of bullish wave c?
Holding above 79,997.81 and breaking 80,928.16 would strengthen the projected advance toward 81,800.