
Key Points
- Bitcoin has broken below its previous $67,500 wave low.
- The recovery to $70,190.1 has given way to renewed selling.
- A fourth-wave rebound remains possible before another bearish extension.
BTCUSD Rate
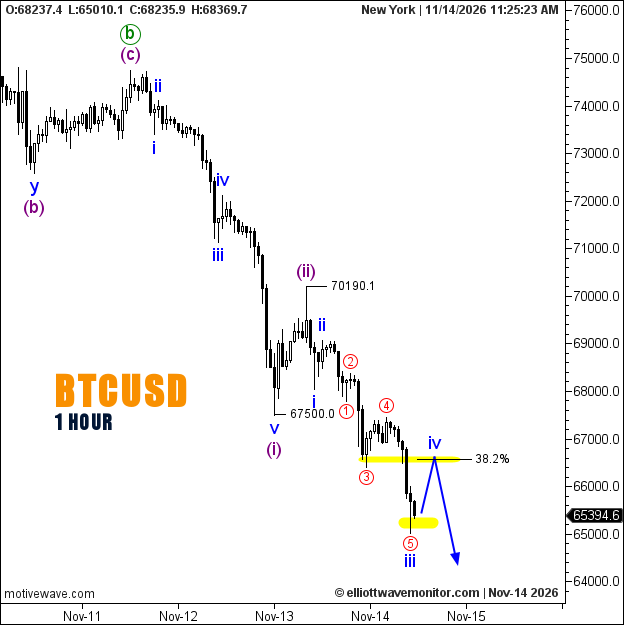
Bitcoin traded at $65,394.6 at 11:25 a.m. New York time, after recording a low of $65,010.1 on the supplied hourly chart.
Bitcoin Elliott Wave Analysis
The bearish sequence outlined in the November 13 Bitcoin outlook has advanced through a corrective recovery and another substantial decline.
Wave (ii) reached $70,190.1 before selling resumed, carrying BTCUSD into blue wave iii, whose five red subdivisions are now visible near the latest low.
The projected path anticipates a wave iv recovery toward the 38.2% Fibonacci retracement, followed by another decline in wave v. However, the third wave's completion still requires confirmation.
Technical Analysis — November 14, 2026
- Trend: Bearish.
- Structure: Blue wave iii, red subdivisions 1–5.
- Fibonacci: 38.2% projected retracement.
- Next Phase: Corrective wave iv, then wave v lower.
Trader's Question: Does the projected rebound signal a bullish reversal?
Not under the current count. A fourth-wave advance would remain corrective unless subsequent price action provides sufficient evidence to challenge the bearish structure.