
Key Points
- Bitcoin's anticipated corrective advance toward $80,000 ended below its projected target.
- Blue wave c and purple wave (x) are now labeled at the recovery peak.
- A temporary Fibonacci retracement could precede further bearish momentum.
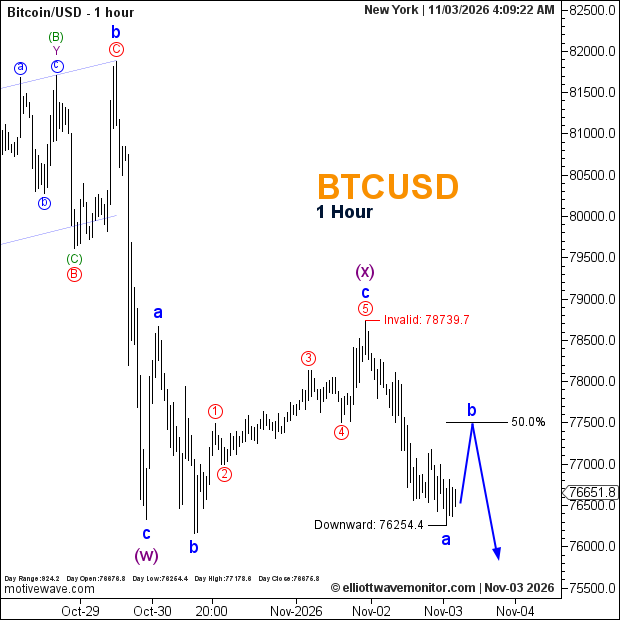
Bitcoin Price: BTCUSD traded at $76,651.8 at 4:09 a.m. New York time. The hourly chart records a daily high of $77,178.8 and a low of $76,254.4.
Bitcoin Elliott Wave Analysis
Bitcoin's recovery ended short of the $80,000 objective outlined in the November 2 Bitcoin price forecast, prompting a significant reassessment of the corrective structure.
The updated count places red wave 5, blue wave c and purple wave (x) at the latest recovery peak. Subsequent selling supports the previously anticipated bearish continuation, although the interim upside target was not achieved.
The decline has reached $76,254.4, below the former $76,330.1 bearish confirmation reference. The projected path now anticipates blue wave b rebounding toward the 50% Fibonacci retracement before another downward extension.
Technical Analysis for November 3, 2026
- Trend: Bearish.
- Wave Structure: Purple (x) provisionally complete; blue a labeled.
- Expected Correction: Blue b toward 50% Fibonacci.
- Recorded Downside: $76,254.4.
- Invalidation: $78,739.7.
Trader's Question: Would a recovery toward the 50% retracement reverse the bearish outlook?
Not necessarily. The proposed rebound is corrective. A renewed decline would support the bearish sequence, while $78,739.7 remains the marked invalidation level.