
Key Points
- Red wave 3 has emerged following the previously anticipated upward extension.
- A fourth-wave pullback is projected before blue wave c advances.
- The broader Elliott Wave outlook continues to favor renewed downside after purple wave (x).
Bitcoin Price
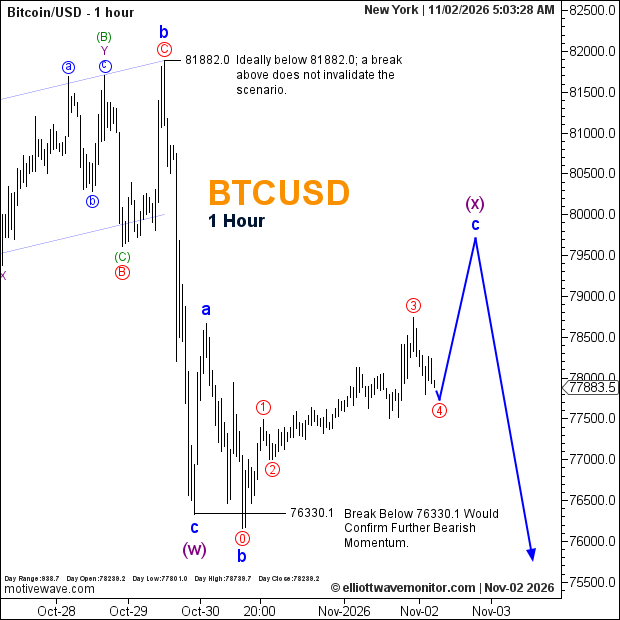
Bitcoin trades at $77,883.5 on the hourly chart as of 5:03 a.m. New York time. The displayed daily range extends from $77,801.0 to $78,739.7, with an opening price of $78,238.2.
Bitcoin Elliott Wave Analysis
Bitcoin's recovery has progressed beyond the initial stages outlined in the November 1 Elliott Wave outlook, with red wave 3 now labeled on the observed price structure.
The developing blue a-b-c correction displays an expanded flat configuration, as wave b moved below the origin of wave a. This structure supports the possibility of another upward extension toward $80,000, where blue wave c could complete purple wave (x).
The projected path first anticipates a red wave 4 retracement, followed by a final recovery phase. Once the corrective sequence concludes, the broader bearish scenario favors another decline.
Technical Analysis for November 2, 2026
- Trend: Corrective recovery within a broader bearish structure.
- Current Elliott Wave: Blue c developing; red wave 4 projected.
- Next Price Target: Approximately $80,000.
- Upper Reference: $81,882.0; a break above does not invalidate the scenario.
- Bearish Confirmation: A renewed break below $76,330.1.
Trader's Question
Does reaching $80,000 confirm a bullish reversal?
No. Under the current wave count, that advance would represent a potential corrective completion. The subsequent price response would determine whether the projected bearish continuation develops.