
Key Points
- Gold has extended its decline to a fresh low of $3,693.58.
- The current recovery may develop into a temporary flat correction.
- Renewed downside remains the projected path after the rebound.
Gold Price
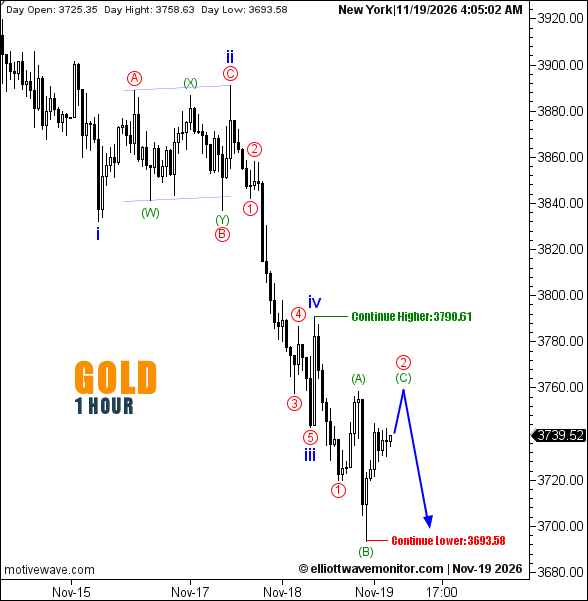
XAUUSD stood at $3,739.52 at 4:05 a.m. New York time, above its daily opening of $3,725.35. The hourly chart recorded a high of $3,758.63 and a low of $3,693.58.
Gold Elliott Wave Analysis
The fourth-wave recovery anticipated in EWM's November 18 gold price analysis is now provisionally marked complete, with subsequent selling establishing another lower trough.
The latest structure identifies red wave ① following blue wave iv. The recovery currently unfolding is expected to form red wave ② through a potential A–B–C flat correction.
Green waves (A) and (B) are already marked, while wave (C) remains projected. Consequently, the rebound may prove temporary rather than signal a sustainable bullish reversal.
Once the correction concludes, the forecast anticipates another downward extension, although its timing and completion remain unconfirmed.
Technical Analysis — November 19, 2026
- Trend: Bearish, H1.
- Structure: Red ②, potential flat correction.
- Upside continuation: $3,790.61.
- Downside continuation: $3,693.58.
Trader's Question: Could the current recovery develop into a sustained uptrend?
The flat-correction scenario does not imply a bullish reversal. A materially stronger advance and structural reassessment would be needed to challenge the prevailing bearish interpretation.