
WTI maintains a sideways corrective outlook with bearish near-term pressure at the displayed 100.249. The Elliott Wave count shows green wave (iv) ending at the October low, followed by a five-wave advance completing purple (i) at blue v. The subsequent blue a-b-c correction is developing within purple (ii), with blue b labeled at the recent high. Compared with October 23, the earlier projected pullback is now reflected in the updated corrective count, although the decline toward 95.052 remains unconfirmed. The blue path projects wave c toward approximately 94.00 before a potential recovery toward 102.00. The annotated 103.276 level invalidates the immediate bearish correction scenario.
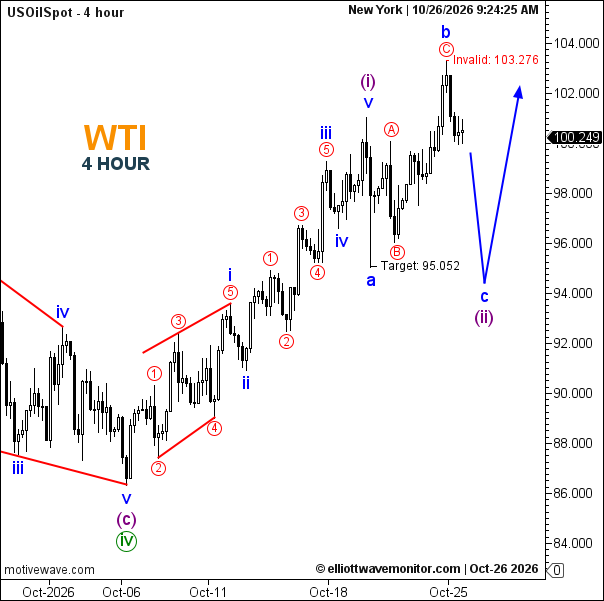
Technical Summary of WTI Crude Oil Price for October 26, 2026
-
Trend: Sideways; corrective bearish pressure.
-
Current Elliott Wave: Purple (ii), with blue c projected downward.
-
Key Support Levels: 95.052 (annotated target); approximately 94.00 (projected).
-
Key Resistance Levels: Approximately 102.00 (projected recovery); 103.276 (invalidation).
-
Next Price Target: 95.052, followed by approximately 94.00.
-
Invalidation Level: 103.276 (annotated).
Trader's Question: Could WTI complete wave (ii) before resuming its advance?
A decline toward 95.052–94.00 could complete the projected wave c, but a bullish reversal would require confirmation from subsequent price action.