
Key Points
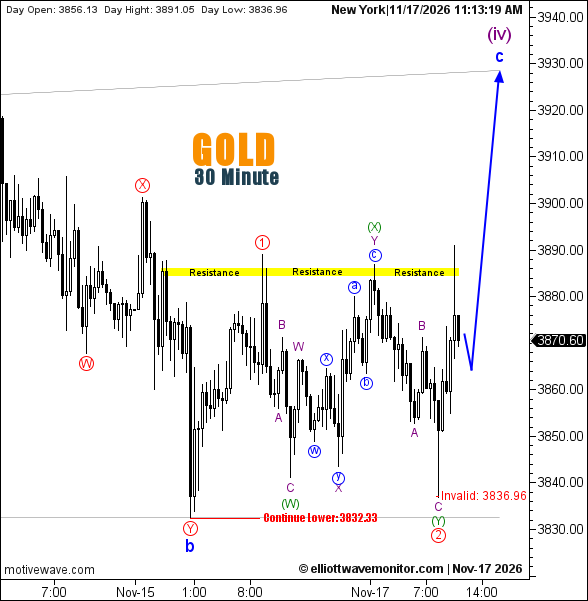
- Red wave ② is provisionally marked at $3,836.96 following a green W–X–Y correction.
- Gold continues to encounter the yellow resistance zone.
- A corrective advance toward $3,930 remains projected.
Gold Price
XAUUSD stood at $3,870.60 at 11:13 a.m. New York time, above the daily opening price of $3,856.13. The 30-minute chart recorded an intraday high of $3,891.05 and a low of $3,836.96.
Gold Elliott Wave Analysis
The limited pullback anticipated in EWM's November 16 gold analysis is now represented by a more detailed corrective structure, with red wave ② tentatively ending alongside green wave (Y).
Despite attempts to trade above the yellow resistance band near $3,885, the chart has yet to establish a sustained breakout.
The projected blue path allows for another brief retreat before wave c advances toward purple wave (iv), near the upper channel boundary around $3,930. This remains a corrective scenario within the broader bearish outlook.
Technical Analysis — November 17, 2026
- Trend: Bearish, with a potential corrective recovery.
- Resistance: Yellow zone near $3,885.
- Upside target: Approximately $3,930.
- Invalidation: $3,836.96.
- Downside continuation: Below $3,832.33.
Trader's Question: Would breaking above resistance confirm wave (iv) is complete?
No. A sustained breakout would strengthen the projected wave c advance, but completion of wave (iv) would still require further structural evidence.