
Key Points
- Gold's hourly structure retains a bearish outlook despite a developing fourth-wave correction.
- Blue wave b is marked at $3,832.33, with wave c remaining incomplete.
- A recovery toward Fibonacci 38.2% could precede renewed selling.
Gold Price
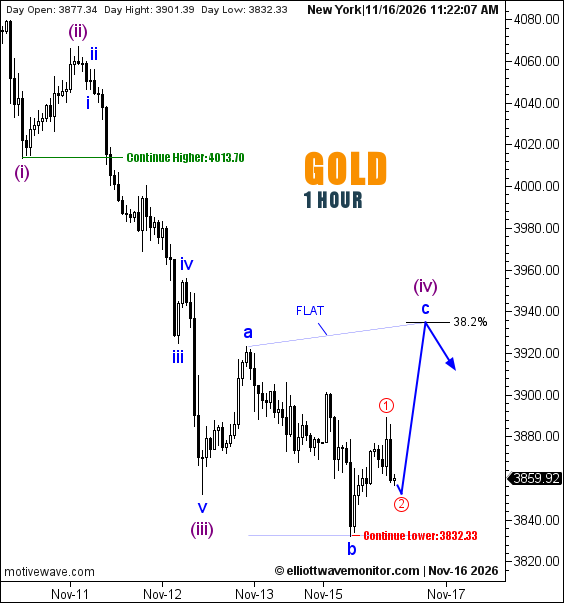
XAUUSD stood at $3,859.92 at 11:22 a.m. New York time. The hourly chart recorded a daily opening price of $3,877.34, a high of $3,901.39, and a low of $3,832.33.
Gold Elliott Wave Analysis
Gold's five-wave decline has provisionally completed purple wave (iii), leaving a flat correction developing toward wave (iv).
The structure identifies blue waves a and b within the observed price action. The projected path anticipates another limited decline toward red wave ② before blue wave c potentially advances toward the 38.2% Fibonacci retracement.
Within the context of EWM's November 16 New York-session gold analysis, this hourly projection remains conditional. A break below $3,832.33 would challenge the immediate recovery path, while completion of wave (iv) could leave room for another bearish extension.
Technical Analysis — November 16, 2026
- Trend: Bearish, H1.
- Structure: Purple (iv), flat correction.
- Fibonacci: 38.2% projected retracement.
- Upside continuation: $4,013.70.
- Downside continuation: $3,832.33.
Trader's Question: Would reaching the 38.2% retracement confirm the end of wave (iv)?
Not independently. The corrective structure would still require confirmation of completion before the anticipated next downward leg could be assessed.