SILVER Forecast

SILVER Forecast

Silver Forecast October 21, 2026: Elliott Wave Outlook

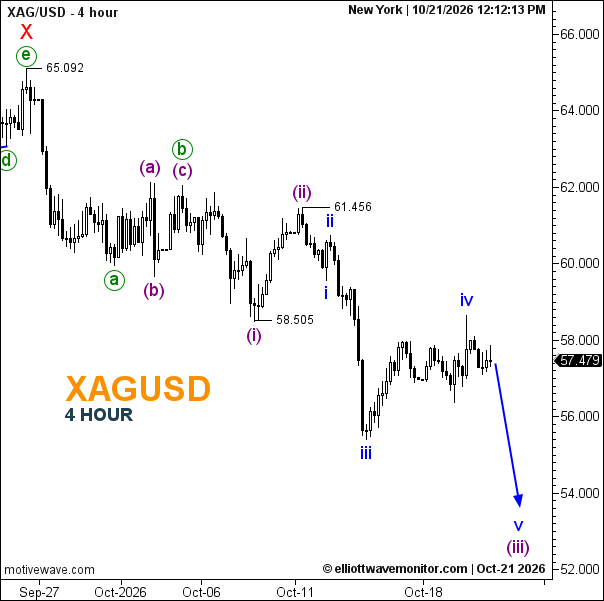
Silver is at 57.479, below the 57.870 level on October 16. The chart maintains a bearish Elliott Wave count: a rebound labeled wave iv is developing after wave iii reached approximately 55.5. It projects one more decline in wave v toward 53.5, within a broader wave (iii) decline. This remains a projected path.
Silver Forecast for October 21, 2026

  • Trend: Bearish while the recovery remains corrective.
  • Trading Range: Approximately 55.5–58.5 near term.
  • Wave Structure: Wave iv is developing; wave v is projected lower.
  • Support: Approximately 55.5, then 53.5.
  • Resistance: Approximately 58.5; then 61.456.

Is silver going up or down? The chart points lower toward 53.5 after the current rebound; a move above 61.456 would challenge this count.
Open article page
News & Analysis

Gold and Silver Face Downside Risk as WTI’s Revised Count Allows Another Rally

  • Gold’s chart favours wave (iii) lower, with 4,217.46 defining the current bearish count’s boundary.
  • Silver’s wave iv rebound has extended; the projected fifth-wave decline remains unconfirmed.
  • WTI’s revised structure allows a final advance toward 102 before a corrective retreat.

Market News

Oil: Rumour-Driven Repricing Meets Shipping Risk

An unverified Qatar–Pakistan mediation report triggered an oil selloff before prices rebounded as the claim was disputed, Barron’s reported on October 20. This is evidence of headline sensitivity, not confirmation of a peace agreement.

Reuters separately reported volatile oil trading amid vessel attacks and claims of strikes on Saudi infrastructure. Supply disruption remains a competing driver. Brent, dated WTI futures and the supplied USOilSpot quote must be distinguished; their prices cannot be substituted for one another.

Metals: The Fed’s Guidance Matters Beyond October

A Reuters poll published October 20 found 94 of 100 economists expected unchanged rates at the October 27–28 meeting, while all anticipated a December increase. This is an economist survey, not a market-implied probability.

Continued tightening expectations can pressure non-yielding metals, but that mechanism alone does not prove what caused every intraday move. The next decision and accompanying guidance will test whether the restrictive outlook persists.

Elliott Wave Analysis

Gold: Corrective Recovery Gives Way to Bearish Pressure

Gold: Corrective Recovery Gives Way to Bearish Pressure

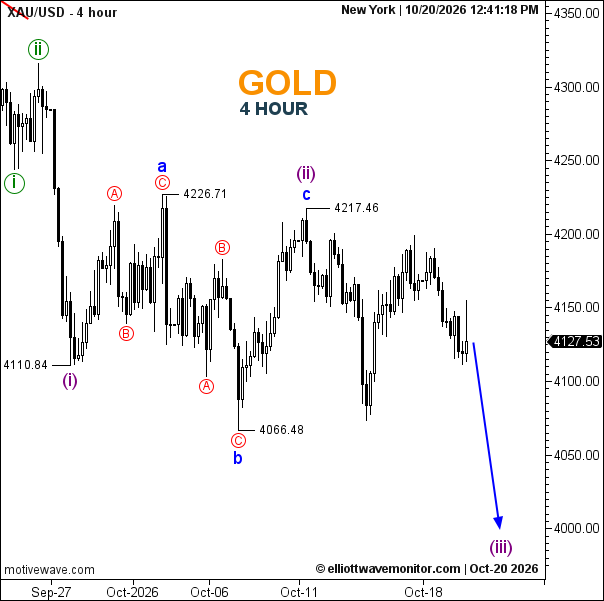
The October 20 four-hour XAU/USD chart, timestamped 12:41:18 New York, shows 4,127.53 per ounce. Wave (i) ends at 4,110.84. The subsequent a–b–c correction includes a at 4,226.71, b at 4,066.48 and c completing (ii) at 4,217.46.

The b overshoot and c’s failure to exceed a are consistent with a running-flat interpretation, although all internal subdivisions are not resolved. The projected (iii) decline points toward roughly 4,000–3,980.

A sustained break beneath 4,110.84, followed by 4,066.48, would strengthen bearish continuation. Recovery above 4,217.46 invalidates the displayed assumption that (iii) is developing from the completed (ii).

Silver: Wave iv Has Extended Since Yesterday

Silver: Wave iv Has Extended Since Yesterday

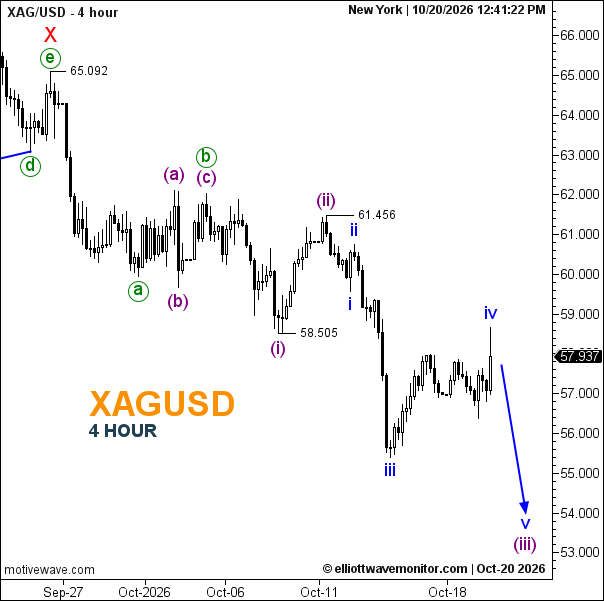
XAG/USD reads 57.937 at 12:41:22 New York. The larger bearish sequence retains (i) at 58.505 and (ii) at 61.456, followed by a developing (iii). Its internal iii low lies around 55.5.

Compared with October 19, iv has stretched above yesterday’s estimated 57.8–58.0 resistance, with a wick approaching 58.7. The earlier assumption of immediate iv completion therefore needed revision; the larger bearish structure has not automatically failed.

Loss of approximately 56.5–57.0 would weaken the rebound, while a break below 55.5 would support v toward roughly 53.5–54.0. Further strength above the latest iv high would delay that path. Crossing 61.456 invalidates the displayed bearish (iii) count.

WTI: A Revised Count Replaces Yesterday’s Immediate Reversal

WTI: A Revised Count Replaces Yesterday’s Immediate Reversal

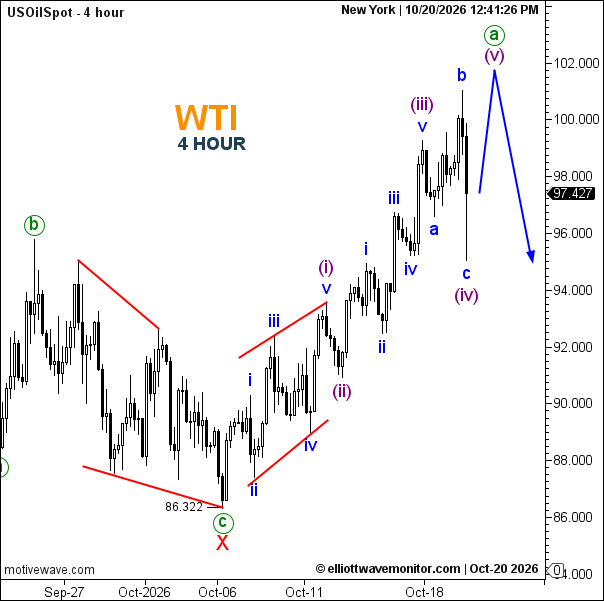
USOilSpot stands at 97.427 per barrel at 12:41:26 New York. The 86.322 low is now labelled X, replacing yesterday’s wave-1 designation. The advance from that low carries (i)–(ii)–(iii), followed by an a–b–c pullback labelled (iv).

The chart projects (v) toward approximately 101.5–102.0, completing a larger a, before a decline toward roughly 95.0. Clearing the recent 100.5–101.0 high area would strengthen the fifth-wave scenario.

A break below the apparent (iv) low near 95.0 would undermine its immediate completion. The projected larger a is not yet complete; the new count replaces yesterday’s proposed wave-2 peak.

Market Outlook

Confirmation now differs across assets: gold needs downside follow-through, silver needs its extended rebound to fail, and oil needs renewed strength before the projected correction. A verified diplomatic breakthrough could challenge oil’s rally path, while renewed disruption could reinforce it. Targets read from arrows remain approximate scenarios.


Open article page

Market guide

About SILVER Forecast

Silver is a precious metal that is widely followed in the global financial markets. It is used both as an investment asset and in a wide range of industrial applications, including electronics, solar energy, automotive technology, and manufacturing. Silver prices are generally quoted in US Dollars and are influenced by economic conditions, industrial demand, investment demand, and developments in global financial markets.

Silver Forecast and Analysis

Our Silver Forecast provides updated market analysis focused on the potential direction of Silver prices. Our analysis covers different timeframes and may include market trends, support and resistance levels, price structure, and potential bullish or bearish scenarios.

At Elliott Wave Monitor, we use Elliott Wave analysis together with technical analysis to study the structure of the Silver market and identify potential price movements. Each analysis is based on the latest available price action and market structure.

What Affects Silver Prices?

Silver prices are influenced by a range of economic, financial, and industrial factors. Industrial demand is particularly important because Silver is widely used in electronics, solar panels, automotive components, and other industrial applications.

Investment demand can also have a significant impact on Silver prices. Changes in investor sentiment, interest rates, inflation expectations, financial market conditions, and demand for precious metals can influence the price of Silver.

The US Dollar is another important factor because Silver is predominantly priced in US Dollars. Changes in the value of the US Dollar can therefore affect Silver prices and international demand for the metal.

Gold prices can also influence Silver because both metals are widely considered precious metals and are often analyzed together. The relationship between Gold and Silver can change depending on economic conditions, market sentiment, and investor demand.

XAG/USD Technical Analysis

Silver Technical Analysis can help traders study important price levels and market structures. Our analysis may include support and resistance levels, trend direction, Elliott Wave counts, potential reversal areas, and different market scenarios.

As market conditions change, technical scenarios can also develop or become invalidated as new price information becomes available. For this reason, our latest Silver analysis is regularly updated on this page.

Latest Silver Forecast

This page brings together the latest Silver Forecast and Silver Analysis from Elliott Wave Monitor. New analysis posts are published regularly, allowing readers to follow Silver price movements across different market conditions and timeframes.

Whether you are looking for a Silver forecast, Silver price analysis, Silver technical analysis, precious metals analysis, or Elliott Wave analysis, this page provides a central place to follow our latest market updates and potential price scenarios.