
WTI crude oil is trading at $99.582, down approximately 1.67% from its daily opening price of $101.275. The chart records an intraday high of $101.545 and a low of $99.088, producing a trading range of $2.457. Prices have moved closer to the annotated $98.831 downside confirmation level, although a break below it has not yet occurred.
WTI Elliott Wave Analysis
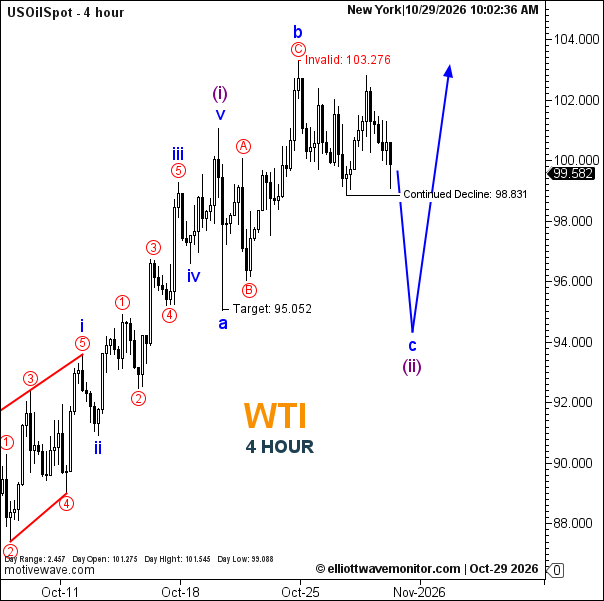
WTI's developing correction has gained further downside traction since the October 28 report, when the market stood at $101.154 and the projected decline toward purple wave (ii) remained ahead. The updated 4-hour chart now shows prices retreating from the red C and blue b high, while the preceding blue a decline and intervening red A–B recovery remain intact within the annotated corrective structure. This deterioration brings the market closer to $98.831, the newly emphasized threshold for continued weakness. A break below that level would strengthen the case for blue wave c extending toward the previously marked $95.052 objective and subsequently the projected purple wave (ii) termination area near $94.00. Importantly, neither downside objective has been reached, and the anticipated completion of wave (ii) remains unconfirmed. The subsequent blue upward projection indicates a potential recovery following the correction, rather than an immediate bullish reversal. The scenario invalidation level remains unchanged at $103.276, preserving the distinction between the developing near-term decline and the broader projected recovery.
Technical Summary of WTI Price for October 29, 2026
-
Trend: Bearish near-term correction within the preceding bullish structure.
-
Current Elliott Wave: Blue b and red C labeled at the corrective high; blue c and purple (ii) projected.
-
Key Support Levels: $98.831 (downside continuation threshold); $95.052 (target).
-
Key Resistance Levels: $103.276 (scenario invalidation).
-
Next Price Target: $95.052, followed by the projected wave (ii) area near $94.00.
-
Invalidation Level: $103.276.
Trader's Question: What would confirm the next corrective decline in WTI?
A move below $98.831 would support the projected extension of blue wave c toward $95.052 and the purple wave (ii) area near $94.00. Until then, the continuation signal remains unconfirmed.