
USDJPY is trading near 157.949 on the 4-hour chart following a corrective rebound from the low labeled purple 1 and blue b. The recovery has developed through the red subdivisions (i)–(v), with blue c, purple 2, and red (v) marked near the latest high. This structure suggests that the upward correction may be approaching completion, although a bearish reversal has not yet been confirmed. The blue downward arrow projects renewed weakness toward 157.604, which serves as the next downside objective. A sustained decline below this level would strengthen the bearish outlook, while a move above 158.604 would invalidate the marked scenario. The broader structure follows the earlier completion of the green (5), red C, and blue x high within the ending diagonal.
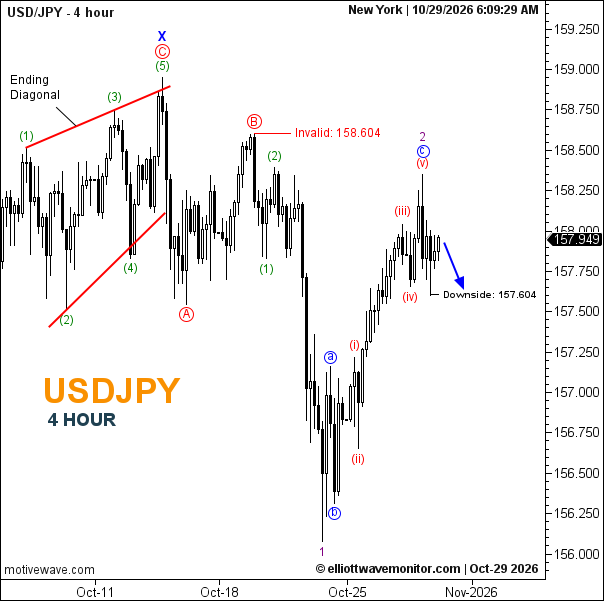
Technical Summary of USDJPY for October 29, 2026
-
Trend: Bearish outlook following a corrective rebound.
-
Current Elliott Wave: Purple 2, blue c, and red (v) labeled at the recent corrective high.
-
Key Support Levels: 157.604; approximately 156.250.
-
Key Resistance Levels: Approximately 158.250; 158.604.
-
Next Price Target: 157.604.
-
Invalidation Level: 158.604.