USDJPY Forecast

USDJPY Forecast

USDJPY Forecast for October 22, 2026
USDJPY Forecast for October 22, 2026

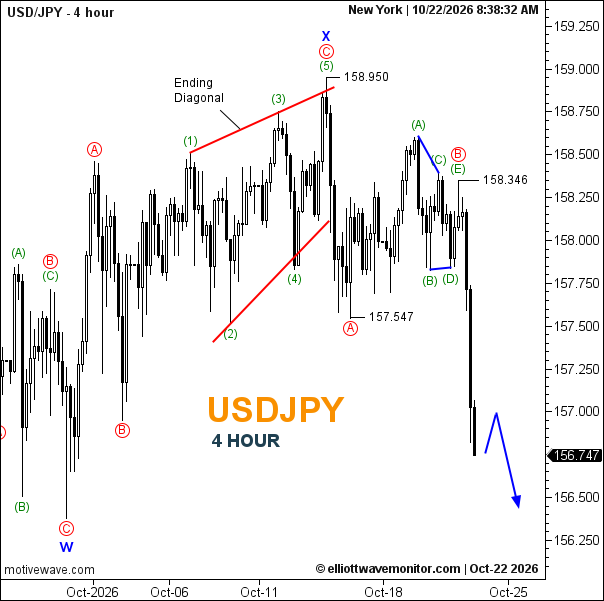
USDJPY maintains a bearish outlook on the 4-hour chart, with sellers driving prices toward 156.747 following a decisive breakdown below 157.547. The Elliott Wave structure identifies the completion of an Ending Diagonal at 158.950, marking wave (5), wave C, and wave X. The subsequent decline established wave A at 157.547, followed by a corrective recovery forming wave B near 158.346. Renewed selling pressure has now pushed prices below wave A, reinforcing bearish momentum and suggesting further downside development. The chart projects a temporary rebound toward 157.000 before the decline resumes toward 156.500, with potential extension toward 156.300. Immediate resistance stands near 157.000, followed by 157.547, while sustained trading below these levels supports the bearish outlook.
Open article page
News & Analysis

Forex Outlook: Sterling and Aussie Rally Into Corrective Tests as USD/CAD Turns Lower

  • GBP/USD and AUD/USD have exceeded earlier confirmation levels, but their charts now allow pullbacks.
  • EUR/USD retains a recovery projection above 1.11129, while USD/JPY favours another downward leg.
  • USD/CAD’s revised count replaces the earlier bullish interpretation with a decline from 1.42999.

Market News

UK Inflation Strengthens the Rate-Hike Debate

UK September CPI rose 3.5% year on year, above the 3.4% forecast and August’s 3.1%, Reuters reported on October 21. Sterling gained as the release strengthened expectations of a November Bank of England hike. A hike remains an expectation, not an announced decision.

Australia and Japan Deliver Different Policy Signals

Reuters reported Australian-dollar gains after RBA Deputy Governor Andrew Hauser warned of a worsening inflation outlook. BOJ Deputy Governor Ryozo Himino also signalled room for higher borrowing costs. French fiscal concerns continued to pressure the euro, while traders awaited next week’s Fed meeting.

Japan’s September exports rose 16.7% against a 20.1% forecast; its ¥536.6 billion trade deficit exceeded the expected ¥181 billion, according to Reuters. That weaker trade surprise complicates the yen backdrop rather than confirming a single currency direction.

Elliott Wave Analysis

AUD/USD: Confirmation Achieved, With B Still Projected

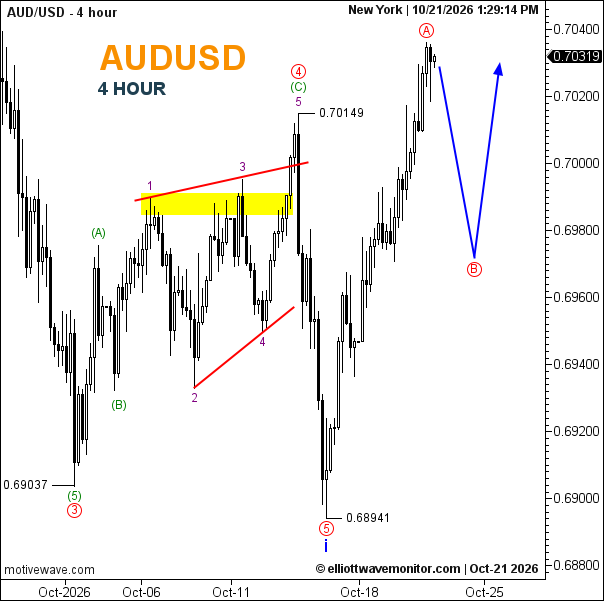
The October 21 four-hour chart shows 0.70319 at 13:29:14 New York. Wave 5 ends at 0.68941, also labelled i on another degree. The subsequent advance is marked A near the latest 0.7035–0.7040 high.

Since October 19, price has cleared the 0.70149 confirmation level, strengthening the completed-low interpretation. The chart now projects B toward approximately 0.6970, followed by recovery toward 0.7030–0.7040. The highlighted 0.6985–0.6990 shelf is an intermediate reference.

A break above the A high would challenge the immediate pullback path. Losing 0.68941 invalidates the assumed completed-low recovery; the chart does not yet show B’s internal pattern.

EUR/USD: Recovery Scenario Survives Consolidation

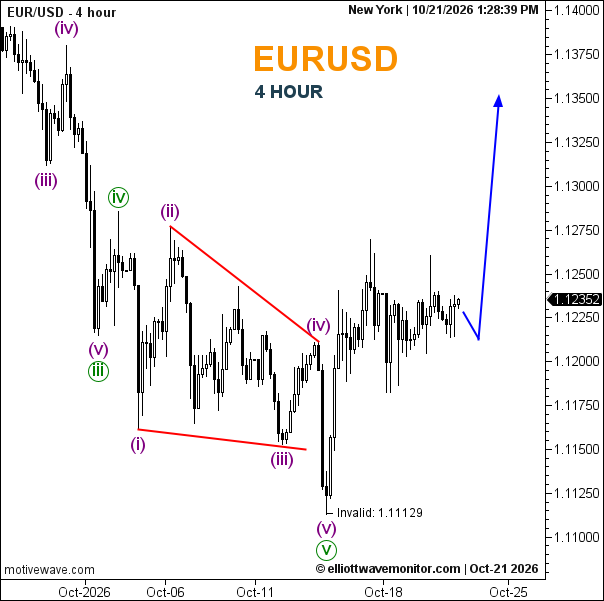
EUR/USD reads 1.12352 at 13:28:39 New York. The five-part ending diagonal, (i)–(ii)–(iii)–(iv)–(v), remains complete at the explicitly marked 1.11129 invalidation boundary.

Price is above October 19’s 1.12085 reference, but has not confirmed the projected upside extension. The path allows a dip toward roughly 1.1210–1.1215 before recovery toward 1.1350.

Clearing the recent 1.1260–1.1270 area would strengthen that advance. Losing 1.11129 invalidates the completed-bottom interpretation and leaves a continuing larger decline as the alternative.

GBP/USD: The Earlier Target Has Been Exceeded

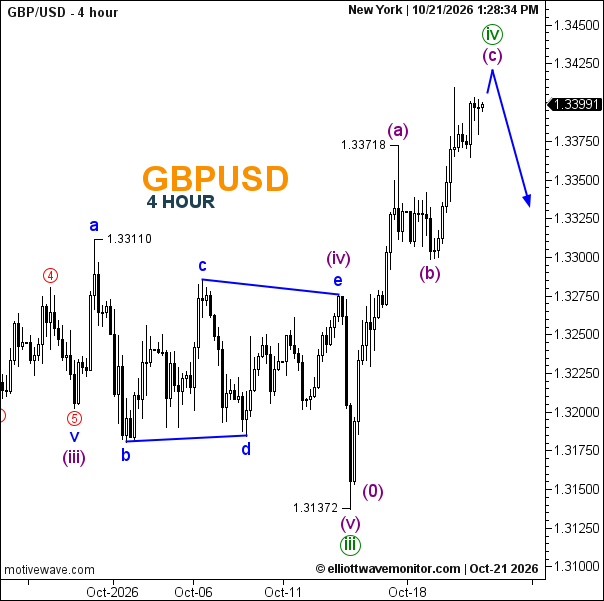
At 13:28:34 New York, GBP/USD stands at 1.33991. The rebound from 1.31372 now carries (a)–(b)–(c) labels within larger wave iv, following completion of wave iii.

Price has exceeded both 1.33718 and the earlier 1.3380–1.3390 target zone. However, the deep 61.8% retracement toward 1.3227 projected on October 19 did not occur; the correction was shallower.

The updated path allows (c) to extend toward approximately 1.3420 before a retreat toward 1.3330. A break below the (b) low around 1.3290–1.3300 would strengthen the reversal case. Further highs would extend iv rather than automatically invalidate the broader count; its definitive upper boundary is outside this chart.

USD/CAD: Revised Count Favours Bearish Continuation

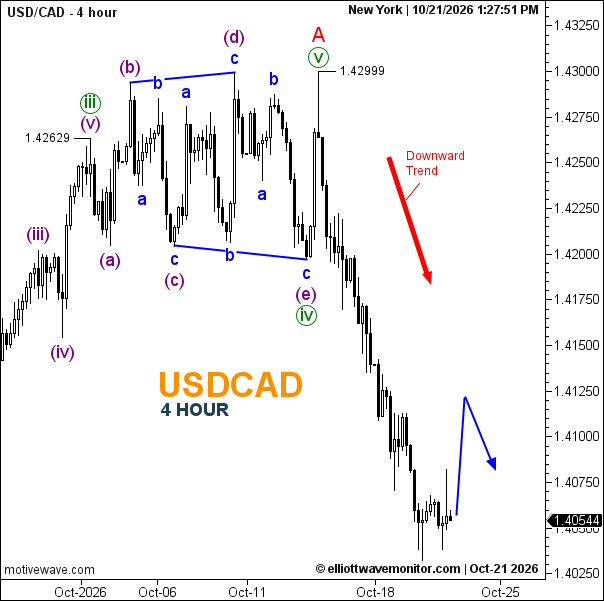
USD/CAD trades at 1.40544 at 13:27:51 New York. The revised structure places an expanding (a)–(b)–(c)–(d)–(e) triangle in wave iv, followed by v completing larger A at 1.42999.

The earlier bullish outlook is no longer the working interpretation: the projected fifth-wave high has formed, followed by a substantial decline. The blue path now allows a bounce toward approximately 1.4120 before weakness toward 1.4080.

The recent 1.4030–1.4050 area is estimated support. Its loss would favour an earlier extension lower; sustained recovery above 1.4120 would weaken the immediate rejection path. Exceeding 1.42999 invalidates the assumed completed-A decline.

USD/JPY: A–B Recovery Leaves C Downside Open

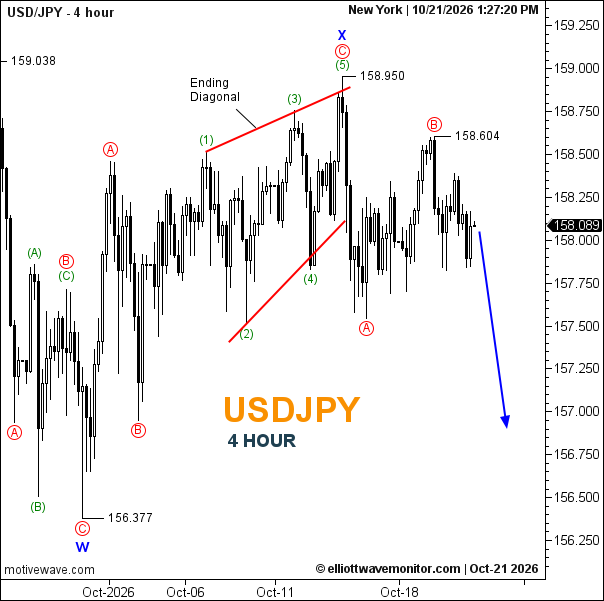
USD/JPY reads 158.089 at 13:27:20 New York. X ended at 158.950 after C formed a five-part ending diagonal. The following decline is labelled A, with B recovering to 158.604.

The new path favours a C decline toward approximately 156.9, extending below October 16’s initial downside projection. Breaking the A low near 157.5 would strengthen continuation, while 156.377 remains a lower historical reference.

Recovery above 158.604 challenges the assumption that B has finished. A move beyond 158.950 invalidates X’s proposed completion; 159.038 is the earlier marked high.

Market Outlook

The key distinction is between completed advances and confirmed reversals. Sterling and the Aussie need evidence of pullback development; the euro needs an upside breakout; USD/CAD and USD/JPY require bearish follow-through. Watch the next Fed decision and domestic policy signals alongside price confirmation, rather than treating any projected arrow as a certainty.

Open article page

Market guide

About USDJPY Forecast

USDJPY, also known as the US Dollar to Japanese Yen currency pair or the Dollar Yen, is one of the most actively followed currency pairs in the forex market. It represents the value of the US Dollar against the Japanese Yen and is closely monitored by traders, investors, financial institutions, central banks, and market analysts worldwide.

USDJPY Forecast and Analysis

Our USDJPY Forecast provides updated market analysis focused on the potential direction of the US Dollar against the Japanese Yen. Our analysis covers different timeframes and may include market trends, support and resistance levels, price structure, and potential bullish or bearish scenarios.

At Elliott Wave Monitor, we use Elliott Wave analysis together with technical analysis to study the structure of the USDJPY market and identify potential price movements. Our analysis may cover monthly, weekly, daily, and shorter-term timeframes depending on market conditions.

What Affects USDJPY?

The USDJPY exchange rate is influenced by a range of economic and financial factors, including interest rates, monetary policy, inflation, employment, economic growth, financial market conditions, and global risk sentiment.

The monetary policies of the US Federal Reserve (Fed) and the Bank of Japan (BoJ) are particularly important for USDJPY. Differences between US and Japanese interest rates and expectations for future monetary policy can have a significant impact on the relative value of the US Dollar and Japanese Yen.

The Japanese Yen can also be influenced by Japan's economic conditions, government policies, financial markets, and changes in investor demand for safe-haven currencies. Developments in the US economy and changes in global market sentiment can also affect USDJPY.

USDJPY Technical Analysis

USDJPY Technical Analysis can help traders study important price levels and market structures. Our analysis may include support and resistance levels, trend direction, Elliott Wave counts, potential reversal areas, and different market scenarios.

As market conditions change, technical scenarios can also develop or become invalidated as new price information becomes available. For this reason, our latest USDJPY analysis is regularly updated on this page.

Latest USDJPY Forecast

This page brings together the latest USDJPY Forecast and USDJPY Analysis from Elliott Wave Monitor. New analysis posts are published regularly, allowing readers to follow the US Dollar against the Japanese Yen across different market conditions and timeframes.

Whether you are looking for a USDJPY forecast, USDJPY technical analysis, Dollar Yen analysis, Japanese Yen analysis, or Elliott Wave analysis, this page provides a central place to follow our latest market updates and potential trading scenarios.