
WTI (USOilSpot) retains a broader bullish structure on the 4-hour chart, while the chart projects a corrective wave (ii) decline from the marked wave (i) high. Price is 101.154. The projected a-b-c correction marks 95.052 as an initial target, with wave c near 94.0; the blue arrow then points higher toward approximately 102.3. A move above the 103.276 invalidation level would invalidate this wave count.
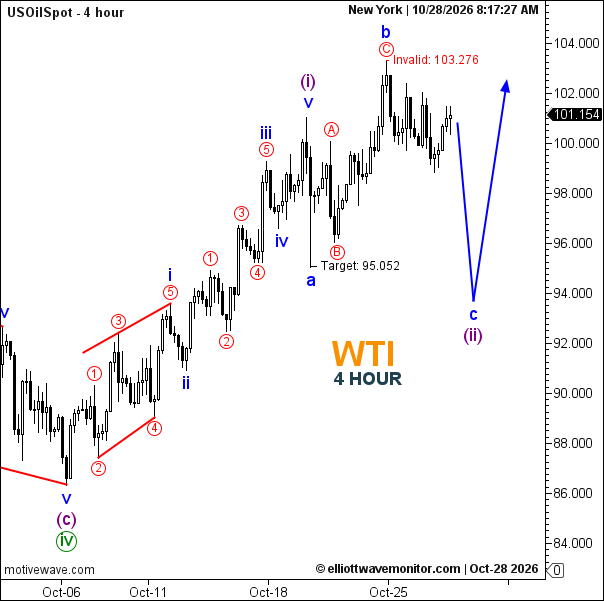
Technical Summary of WTI Price for October 28, 2026
- Trend: Bullish structure, with a corrective pullback projected.
- Current Elliott Wave: Wave (i) is marked near the high; wave (ii) is projected as an a-b-c correction.
- Key Support Levels: 95.052; approximately 94.0 at the projected wave c.
- Key Resistance Levels: Approximately 102.3; 103.276 invalidation level.
- Next Price Target: 95.052, then approximately 94.0; a rebound toward 102.3 is projected afterward.
- Invalidation Level: 103.276.
- Fibonacci Levels: Not shown.
Trader’s Question: Does the chart project a pullback before a recovery?
Yes. It projects wave (ii) toward 95.052 and then near 94.0, followed by an upward arrow. The count is invalidated above 103.276.