
- Both four-hour charts label the latest major low as W, with an X-wave recovery projected.
- Bitcoin’s 79,690.25 and Ethereum’s 2,316.35 lows separate rebound development from renewed downside.
- Institutional custody expansion contrasts with index-related risks surrounding crypto treasury companies.
Market News
Reuters reported on October 16 that Deutsche Bank plans to introduce custody for bitcoin and ether within weeks, initially in Germany. This concerns infrastructure access; it does not establish fresh spot demand or explain today’s rebound.
Separately, Reuters reported that Strategy faces possible MSCI removal under new eligibility rules. The final list is due November 11, with implementation November 30. Potential equity-fund selling should not be confused with confirmed bitcoin liquidation.
Elliott Wave Analysis: Bitcoin W Completed, X Recovery Projected
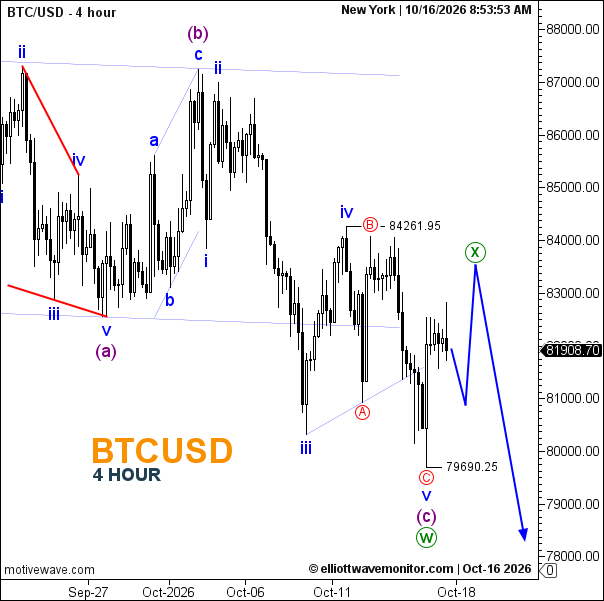
The October 16 chart, timestamped 08:53:53 New York, shows BTC/USD at 81,908.70 on the four-hour timeframe. The larger sequence marks (a), (b), and (c), with the final decline subdivided into i–ii–iii–iv–v. Wave v ends at 79,690.25, completing (c) and the higher-degree W.
The blue path anticipates an initial pullback followed by an X-wave advance toward approximately 83,500–84,000. These are visual estimates, not printed targets. Resistance at 84,261.95 is explicitly marked. Holding the W low supports the rebound interpretation, although the projected X peak has not formed.
A subsequent rejection and break below 79,690.25 would support another downward corrective leg, potentially Y. The arrow approaches 78,000–78,500, an indicative destination rather than a guaranteed objective.
Elliott Wave Analysis: Ethereum Recovery Meets Broken Support
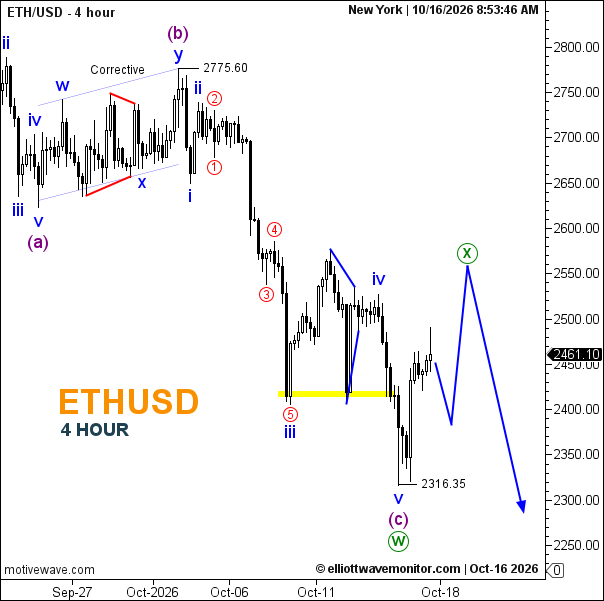
ETH/USD stands at 2,461.10 on the chart timestamped 08:53:46 New York. Its completed (c) decline carries five-wave labels, ending at 2,316.35 and completing W. The preceding (b) correction contains w–x–y subdivisions beneath the marked 2,775.60 high.
The highlighted area near 2,410–2,420 represents a former support shelf and immediate decision zone. The projected path dips first, then rebounds toward an X region around 2,550–2,560 before turning lower. Those zones are read approximately from the scale.
Market Outlook
The working interpretation remains corrective recovery within a bearish structure. Ethereum’s break below 2,316.35 would support renewed decline toward roughly 2,280–2,300. For both instruments, losing the W low before the projected rebound develops invalidates that immediate path. Sustained strength beyond the projected X regions would require reassessment; those regions alone are not formal Elliott Wave invalidation levels.