
BTCUSD Forecast

Elliott Wave analysis, market structure and the latest BTC/USD forecasts.

News & Analysis

Bitcoin and Ethereum Rebounds Face a Corrective Test

  • Both four-hour charts label the latest major low as W, with an X-wave recovery projected.
  • Bitcoin’s 79,690.25 and Ethereum’s 2,316.35 lows separate rebound development from renewed downside.
  • Institutional custody expansion contrasts with index-related risks surrounding crypto treasury companies.

Market News

Reuters reported on October 16 that Deutsche Bank plans to introduce custody for bitcoin and ether within weeks, initially in Germany. This concerns infrastructure access; it does not establish fresh spot demand or explain today’s rebound.

Separately, Reuters reported that Strategy faces possible MSCI removal under new eligibility rules. The final list is due November 11, with implementation November 30. Potential equity-fund selling should not be confused with confirmed bitcoin liquidation.

Elliott Wave Analysis: Bitcoin W Completed, X Recovery Projected
Elliott Wave Analysis: W Completed, X Recovery Projected

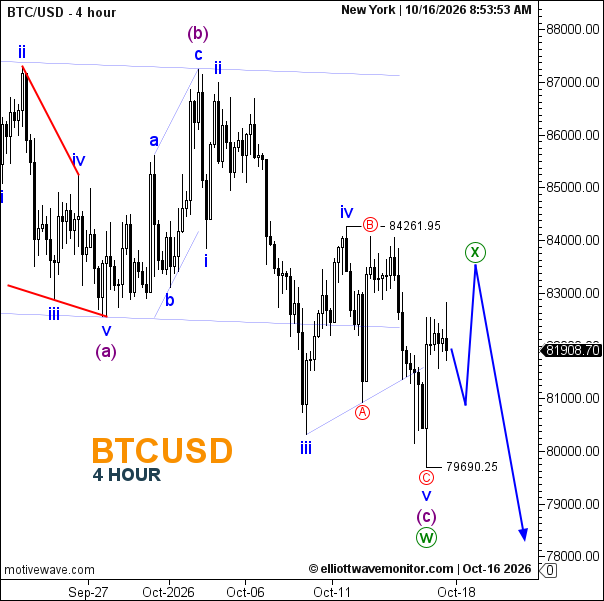
The October 16 chart, timestamped 08:53:53 New York, shows BTC/USD at 81,908.70 on the four-hour timeframe. The larger sequence marks (a), (b), and (c), with the final decline subdivided into i–ii–iii–iv–v. Wave v ends at 79,690.25, completing (c) and the higher-degree W.

The blue path anticipates an initial pullback followed by an X-wave advance toward approximately 83,500–84,000. These are visual estimates, not printed targets. Resistance at 84,261.95 is explicitly marked. Holding the W low supports the rebound interpretation, although the projected X peak has not formed.

A subsequent rejection and break below 79,690.25 would support another downward corrective leg, potentially Y. The arrow approaches 78,000–78,500, an indicative destination rather than a guaranteed objective.

Elliott Wave Analysis: Ethereum Recovery Meets Broken Support
Ethereum: Recovery Meets Broken Support

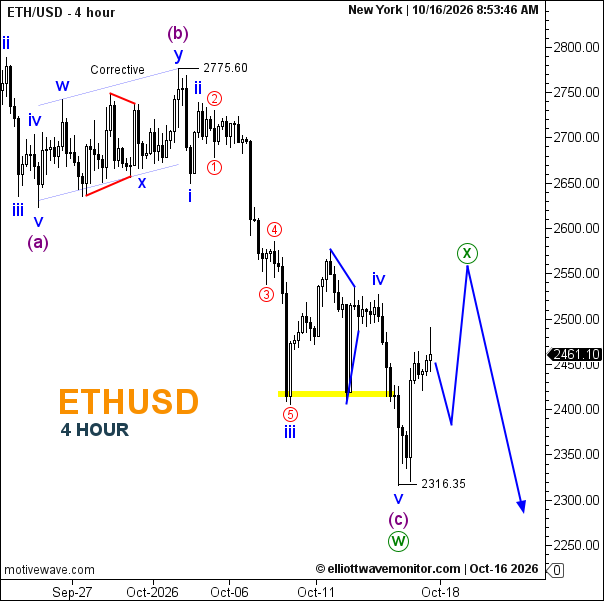
ETH/USD stands at 2,461.10 on the chart timestamped 08:53:46 New York. Its completed (c) decline carries five-wave labels, ending at 2,316.35 and completing W. The preceding (b) correction contains w–x–y subdivisions beneath the marked 2,775.60 high.

The highlighted area near 2,410–2,420 represents a former support shelf and immediate decision zone. The projected path dips first, then rebounds toward an X region around 2,550–2,560 before turning lower. Those zones are read approximately from the scale.

Market Outlook

The working interpretation remains corrective recovery within a bearish structure. Ethereum’s break below 2,316.35 would support renewed decline toward roughly 2,280–2,300. For both instruments, losing the W low before the projected rebound develops invalidates that immediate path. Sustained strength beyond the projected X regions would require reassessment; those regions alone are not formal Elliott Wave invalidation levels.
Open article page
BTCUSD Forecast

Bitcoin Price Forecast for October 15, 2026

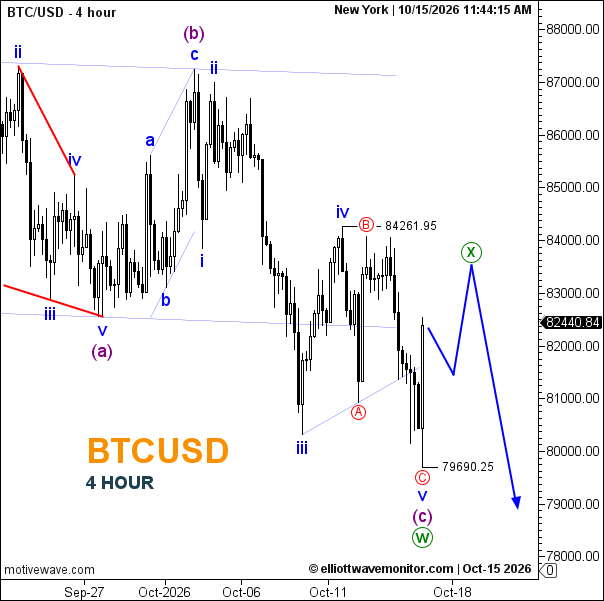
Bitcoin Rate: BTCUSD traded at $82,440.84 on the four-hour chart at 11:44 AM New York time, rebounding after reaching $79,690.25.

Bitcoin Elliott Wave Analysis

Bitcoin Price Forecast for October 15, 2026

Yesterday’s bearish forecast materialized as Bitcoin broke below $81,000, completing a five-wave decline from the $84,261.95 wave B high.

The updated count suggests wave (c), and potentially the larger wave W, ended at $79,690.25. A corrective wave X rebound may now develop before another decline in wave Y.

  • Wave Structure: W–X–Y correction; wave X potentially underway.
  • Support: $81,000 and $79,690.25.
  • Resistance: $83,000 and $84,261.95.

A pullback toward $81,500 could precede a recovery toward $84,000. Subsequently, wave Y may target the $79,000 region. A break below $79,690.25 before a meaningful rebound would weaken the proposed wave X scenario.

Bitcoin News: US producer prices surged 1.3% in September, exceeding the 0.6% forecast, while retail sales rose 0.8%. Persistent inflation strengthened concerns about higher interest rates, weighing on cryptocurrency sentiment.

Open article page

Market guide

About BTCUSD Forecast

Bitcoin (BTC) is the first widely established cryptocurrency and one of the most closely followed digital assets in the global financial markets. Bitcoin operates on a decentralized blockchain network that enables transactions to be recorded and verified without relying on a traditional central authority. It is followed by traders, investors, financial institutions, asset managers, and market analysts worldwide.

Bitcoin Forecast and Analysis

Our Bitcoin Forecast provides updated market analysis focused on the potential direction of Bitcoin prices. Our analysis covers different timeframes and may include market trends, support and resistance levels, price structure, and potential bullish or bearish scenarios.

At Elliott Wave Monitor, we use Elliott Wave analysis together with technical analysis to study the structure of the Bitcoin market and identify potential price movements. Each analysis is based on the latest available price action and market structure.

What Affects Bitcoin Prices?

Bitcoin prices are influenced by a range of financial, economic, technological, and regulatory factors. Market sentiment, investor demand, liquidity, institutional participation, and broader conditions in global financial markets can all affect Bitcoin's price movements.

Bitcoin's limited maximum supply and its scheduled halving mechanism are also important characteristics of the cryptocurrency. The supply of Bitcoin is capped at 21 million BTC, while new Bitcoin issuance is reduced through periodic halving events.

Regulatory developments, cryptocurrency adoption, blockchain activity, and changes in institutional demand can also influence Bitcoin. The performance of other major cryptocurrencies and developments across the broader digital asset market may affect market sentiment as well.

Bitcoin can also be sensitive to changes in interest rates, liquidity conditions, and movements in the US Dollar. During periods of changing risk sentiment, Bitcoin may experience significant price volatility.

Bitcoin Technical Analysis

Bitcoin Technical Analysis can help traders study important price levels and market structures. Our analysis may include support and resistance levels, trend direction, Elliott Wave counts, potential reversal areas, and different market scenarios.

As market conditions change, technical scenarios can also develop or become invalidated as new price information becomes available. For this reason, our latest Bitcoin analysis is regularly updated on this page.

Latest Bitcoin Forecast

This page brings together the latest Bitcoin Forecast and Bitcoin Analysis from Elliott Wave Monitor. New analysis posts are published regularly, allowing readers to follow Bitcoin price movements across different market conditions and timeframes.

Whether you are looking for a Bitcoin forecast, BTC price analysis, Bitcoin technical analysis, cryptocurrency analysis, or Elliott Wave analysis, this page provides a central place to follow our latest market updates and potential price scenarios.