
BTCUSD Forecast

Elliott Wave analysis, market structure and the latest BTC/USD forecasts.

BTCUSD Forecast

Bitcoin Forecast for October 20, 2026

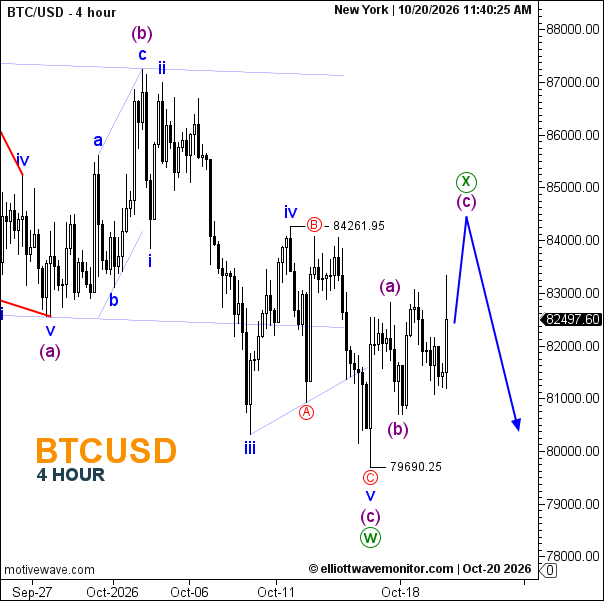
Bitcoin’s four-hour chart shows 82,497.60 versus yesterday’s 82,377.20, with 79,690.25 still intact. Corrective wave X remains developing through (a)–(b)–(c); the projected (c) advance has not reached its endpoint. The updated path points toward approximately 84,400, above 84,261.95, before a potential decline toward 80,400. Crossing 84,261.95 would therefore fit an extended X rather than automatically invalidate the broader bearish interpretation.
Bitcoin Forecast for October 20, 2026

  • Trend: Corrective recovery within a bearish structure.
  • Trading Range: Approximately 80,700–83,400.
  • Wave Structure: W labelled complete at 79,690.25; X remains unfinished.
  • Support: Around 80,700, then 79,690.25.
  • Resistance: 84,261.95; projected area near 84,400.

Will Bitcoin go up?
The count allows further recovery while the (b) low near 80,700 holds. Breaking that low would challenge the immediate (c) advance; losing 79,690.25 would support renewed downside.

BTCUSD News

U.S. spot Bitcoin ETFs attracted approximately $527 million in net inflows, providing a positive demand signal. However, one strong session does not establish a sustained recovery in investment appetite.

For the coming minutes and hours, the inflow news offers a modest bullish impulse for BTC, tempered by restrictive monetary conditions. September’s 3.7% U.S. inflation reading keeps further tightening relevant: higher expected interest rates increase the appeal of interest-bearing assets and can discourage speculative exposure.

An anticipated Fed hold at 3.75–4.00% would offer limited surprise. What matters next is whether ETF inflows persist and whether fresh policy signals alter expectations for additional hikes.
Open article page
BTCUSD Forecast

Bitcoin Forecast for October 19, 2026

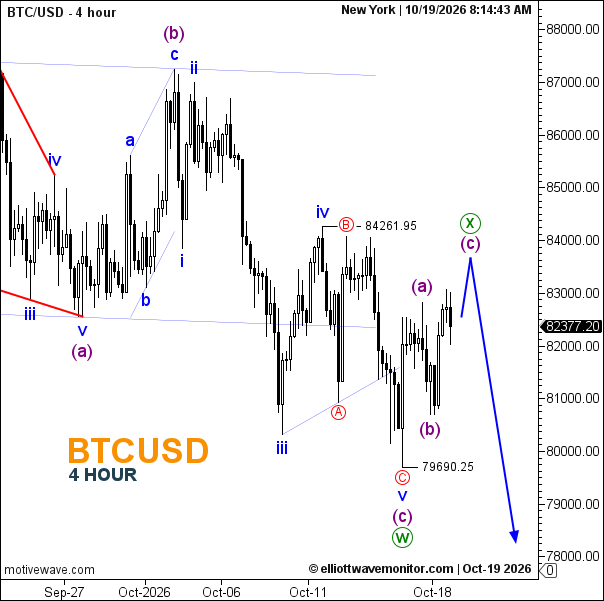
Bitcoin is shown at 82,377.20 on the four-hour chart, recovering from 79,690.25, where the count marks W complete. The rebound is labelled (a)–(b)–(c) within corrective wave X. With (a) and (b) marked, the projected (c) could lift price toward approximately 83,700 before renewed weakness toward 78,300. Neither projected move is complete. Breaking 79,690.25 would support bearish continuation; exceeding 84,261.95 would weaken the illustrated rebound-then-decline scenario.

Bitcoin Forecast for October 19, 2026

  • Trend: Corrective rally within a broader bearish structure.
  • Trading Range: Broad visible boundaries at 79,690.25–84,261.95.
  • Wave Structure: W labelled complete; X developing through (a)–(b)–(c).
  • Support: Approximately 80,500, then 79,690.25.
  • Resistance: Around 83,700, followed by 84,261.95.
Open article page

Market guide

About BTCUSD Forecast

Bitcoin (BTC) is the first widely established cryptocurrency and one of the most closely followed digital assets in the global financial markets. Bitcoin operates on a decentralized blockchain network that enables transactions to be recorded and verified without relying on a traditional central authority. It is followed by traders, investors, financial institutions, asset managers, and market analysts worldwide.

Bitcoin Forecast and Analysis

Our Bitcoin Forecast provides updated market analysis focused on the potential direction of Bitcoin prices. Our analysis covers different timeframes and may include market trends, support and resistance levels, price structure, and potential bullish or bearish scenarios.

At Elliott Wave Monitor, we use Elliott Wave analysis together with technical analysis to study the structure of the Bitcoin market and identify potential price movements. Each analysis is based on the latest available price action and market structure.

What Affects Bitcoin Prices?

Bitcoin prices are influenced by a range of financial, economic, technological, and regulatory factors. Market sentiment, investor demand, liquidity, institutional participation, and broader conditions in global financial markets can all affect Bitcoin's price movements.

Bitcoin's limited maximum supply and its scheduled halving mechanism are also important characteristics of the cryptocurrency. The supply of Bitcoin is capped at 21 million BTC, while new Bitcoin issuance is reduced through periodic halving events.

Regulatory developments, cryptocurrency adoption, blockchain activity, and changes in institutional demand can also influence Bitcoin. The performance of other major cryptocurrencies and developments across the broader digital asset market may affect market sentiment as well.

Bitcoin can also be sensitive to changes in interest rates, liquidity conditions, and movements in the US Dollar. During periods of changing risk sentiment, Bitcoin may experience significant price volatility.

Bitcoin Technical Analysis

Bitcoin Technical Analysis can help traders study important price levels and market structures. Our analysis may include support and resistance levels, trend direction, Elliott Wave counts, potential reversal areas, and different market scenarios.

As market conditions change, technical scenarios can also develop or become invalidated as new price information becomes available. For this reason, our latest Bitcoin analysis is regularly updated on this page.

Latest Bitcoin Forecast

This page brings together the latest Bitcoin Forecast and Bitcoin Analysis from Elliott Wave Monitor. New analysis posts are published regularly, allowing readers to follow Bitcoin price movements across different market conditions and timeframes.

Whether you are looking for a Bitcoin forecast, BTC price analysis, Bitcoin technical analysis, cryptocurrency analysis, or Elliott Wave analysis, this page provides a central place to follow our latest market updates and potential price scenarios.