
Price action: XAUUSD is at 3,909.76, down 2.77% from the day open of 4,021.33. The displayed high is 4,026.50 and low is 3,908.65, producing a current range of 117.85 points. Price is 1.11 points above the displayed low.
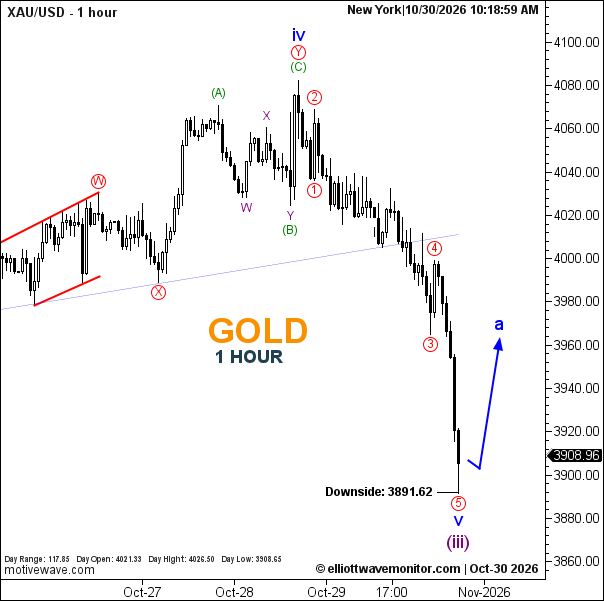
Elliott Wave analysis: The latest published London update showed price at 3,988.67 and projected a corrective recovery toward 4,010 before further downside below 3,979.33. Price has since fallen below that reference. Today’s chart presents a further-developed count: red circled ③ and ④ are marked, with red circled ⑤ projected lower toward the annotated 3,891.62 area. Blue V and purple (iii) are also labeled near the projected low, followed by a projected blue a recovery. The earlier report’s 4,068.99 invalidation is not shown on this chart, so I cannot confirm it remains the active level.
Technical Summary
- Trend: Bearish, with a corrective recovery projected after further downside
- Current Elliott Wave: Red circled ③ and ④ marked; red circled ⑤, blue V, and purple (iii) shown near the projected low
- Downside Reference: 3,891.62
- Next Projected Move: Further downside, then a blue a recovery
Q: Has XAUUSD reached the projected downside area?
A: No. The chart marks 3,891.62 as a further-downside reference; the displayed price is 3,909.76.