
Ethereum is trading at $2,231.25, down approximately 1.05% from its daily opening price of $2,255.40. The cryptocurrency has recorded an intraday high of $2,291.25 and a low of $2,170.45, producing a range of $120.80. The latest price remains above the session low, following a substantial intraday decline.
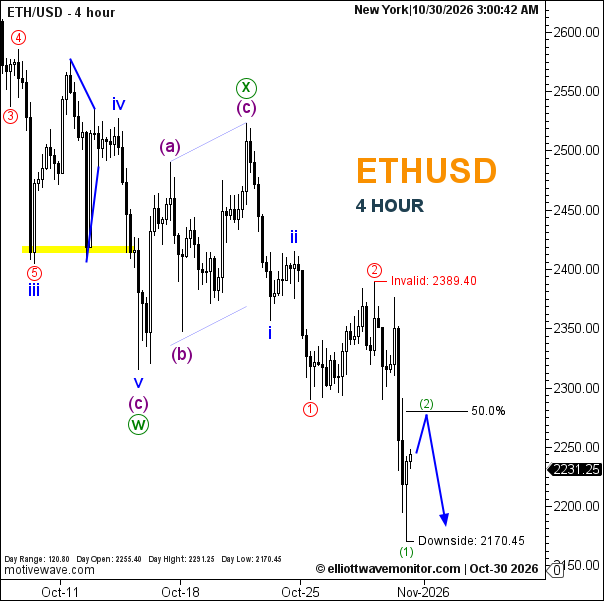
Ethereum's latest decline has brought the bearish sequence into a more advanced stage, with the October 30 chart marking green wave (1) at $2,170.45 and projecting a corrective recovery in green wave (2) before further weakness. This extends the bearish development described in the accessible October 28 report, which anticipated blue wave iii following a corrective rebound. The updated structure now identifies blue waves i and ii, followed by red waves ① and ②, with red ① terminating at the recent low and red ② at the subsequent recovery high. The sharp decline toward $2,170.45 is labeled green (1), while the blue projection anticipates green (2) rising toward the 50.0% Fibonacci retracement near $2,280. A rejection from this region would support another downward leg toward the chart's marked $2,170.45 reference. The immediate bearish scenario is invalidated at $2,389.40, a substantially lower threshold than the $2,523.20 level in the October 28 report. However, the projected recovery and renewed decline remain unconfirmed.
Technical Summary of Ethereum Price for October 30, 2026
-
Trend: Bearish, with a corrective rebound projected.
-
Current Elliott Wave: Green (1) labeled at the recent low; green (2) projected as a corrective recovery.
-
Key Support Levels: $2,170.45.
-
Key Resistance Levels: Approximately $2,280 (50.0% Fibonacci); $2,389.40.
-
Next Price Target: Corrective rebound toward $2,280, followed by potential renewed downside toward $2,170.45.
-
Invalidation Level: $2,389.40.
-
Fibonacci Levels: 50.0% retracement near $2,280.
Trader's Question: Is Ethereum preparing for a corrective rebound before another decline?
The 4-hour projection favors a temporary recovery toward the 50.0% Fibonacci level near $2,280, followed by renewed weakness. This sequence remains conditional, with $2,389.40 marking the bearish scenario's invalidation level.