
Crude Oil Forecast

News & Analysis

Silver Faces Another Downward Leg as WTI Tests a Corrective Peak

  • Silver’s rebound remains labelled wave iv, with wave v projected to complete the larger (iii).
  • WTI’s a–b–c recovery may have completed wave 2; a bearish reversal still requires confirmation.
  • Russian supply-policy uncertainty and the approaching Federal Reserve decision remain key external risks.

Market News

Oil: Policy Relief Does Not Guarantee More Supply

Oil declined on October 19 as traders weighed a waiver of newly imposed US sanctions on Russia against Middle East supply risks, The Wall Street Journal reported. Its December WTI futures quote is a different instrument from the supplied USOilSpot chart.

Reuters separately highlighted uncertainty over whether Russian exports could actually increase, alongside continuing shipping disruption. For traders, the distinction matters: expectations of easier supply can lower prices before additional barrels reach the market. Renewed disruption could challenge that repricing.

Silver: An Intraday Rise Within a Weaker Structure

Reuters reported spot silver at $57.49 earlier on Monday, with next week’s Fed decision and US PCE inflation data in focus. That earlier market quote should remain separate from the later chart reference. A positive session does not establish a technical trend reversal.

Elliott Wave Analysis

Silver: Wave iv Recovery Leaves Wave v Outstanding
Silver: Wave iv Recovery Leaves Wave v Outstanding

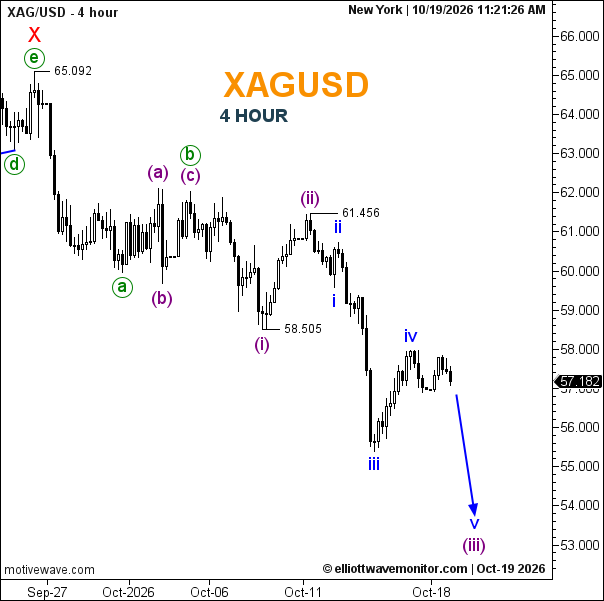
The October 19 four-hour XAG/USD chart, timestamped 11:21:26 New York, shows $57.182 per ounce. The broader decline follows the marked X high at 65.092.

The count identifies (i) ending at 58.505 and (ii) at 61.456. Within the subsequent bearish (iii), waves i, ii and iii are labelled complete, followed by an iv rebound toward approximately 57.8–58.0. The projected v has not yet completed.

A break beneath the recent wave-iii low around 55.5 would strengthen the continuation case toward approximately 53.5–54.0, where the arrow anticipates completion of (iii). These zones are estimated from the scale, rather than printed targets.

Sustained recovery above the apparent iv high would require reassessing its completion. A move above 61.456 would invalidate the displayed bearish (iii) developing from the (ii) peak, although it would not automatically establish a broader uptrend.

WTI: A Five-Wave Advance Completes the Corrective C Leg
WTI: A Five-Wave Advance Completes the Corrective C Leg

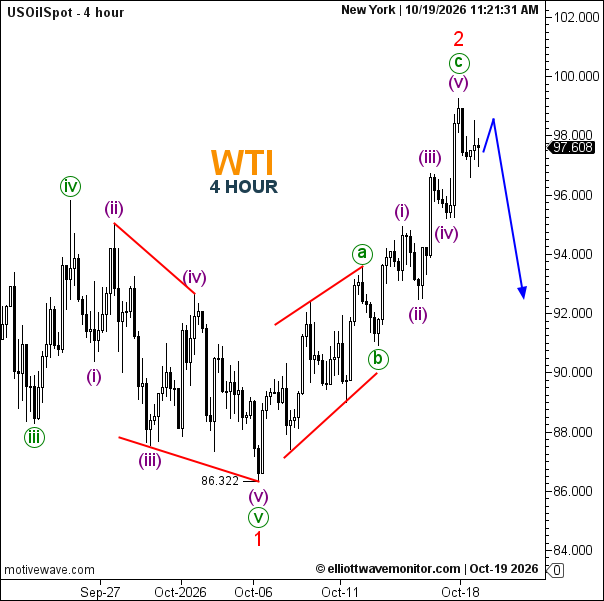
USOilSpot reads $97.608 per barrel at 11:21:31 New York. The preceding decline ends at 86.322, labelled wave 1. The subsequent a–b–c recovery places wave 2 near the recent 99.0–99.3 peak.

Wave c contains (i)–(ii)–(iii)–(iv)–(v), supporting a zigzag interpretation for the recovery. The blue path allows an initial bounce toward roughly 98.5 before a decline toward 92.5–93.0.

Loss of the recent 96.5–97.0 support area would strengthen the reversal case, with approximately 94.0–94.5 an intermediate reference. A fresh high above the apparent wave-2 endpoint would invalidate its immediate completion assumption. The chart does not show wave 1’s origin, so a definitive larger-degree invalidation cannot be assigned.

Market Outlook

Silver already carries a bearish internal sequence, while oil requires evidence that its recovery has ended. The next useful confirmation is price follow-through below local support. Fed guidance and inflation data could alter the metals backdrop; verified changes in export availability and shipping conditions could reshape oil’s supply premium. Neither projected arrow is a guaranteed outcome.
 
Open article page
Crude Oil Forecast

Crude Oil Forecast for October 16, 2026

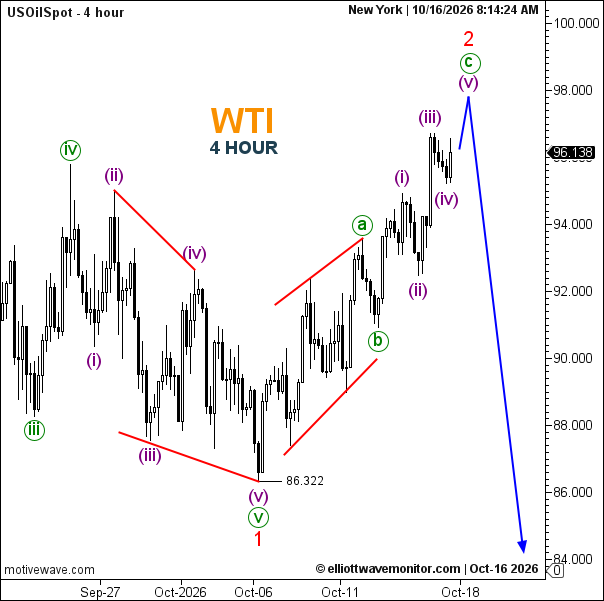
WTI’s wave count has been fully revised. The four-hour chart shows 96.138, with wave 1 completed at 86.322 and a corrective wave 2 developing as a–b–c. Within c, the labels suggest (i)–(iv) have formed, leaving a potential (v) advance toward approximately 98.00. The projected decline toward 84.00 remains conditional on wave 2 completing. Breaking the (iii) high would support the final advance; losing the (iv) low would challenge its proposed completion.

Crude Oil Forecast for October 16, 2026

  • Trend: Corrective rally within the revised bearish count.
  • Trading Range: No clearly established sideways range.
  • Wave Structure: Wave 2 unfolds as a–b–c; (v) of c remains anticipated.
  • Support: The (iv) low near 95.00; major support at 86.322.
  • Resistance: Approximately 96.75, then the projected 98.00 area.
Open article page

Market guide

About Crude Oil Forecast

Crude Oil is one of the most widely followed commodities in the global financial markets. Oil prices are closely monitored by traders, investors, financial institutions, businesses, and market analysts because of their importance to the global economy and energy markets. Crude Oil is generally priced in US Dollars and is influenced by global supply and demand, economic conditions, geopolitical developments, and energy-market dynamics.

Crude Oil Forecast and Analysis

Our Crude Oil Forecast provides updated market analysis focused on the potential direction of Oil prices. Our analysis covers different timeframes and may include market trends, support and resistance levels, price structure, and potential bullish or bearish scenarios.

At Elliott Wave Monitor, we use Elliott Wave analysis together with technical analysis to study the structure of the Crude Oil market and identify potential price movements. Each analysis is based on the latest available price action and market structure.

What Affects Crude Oil Prices?

Crude Oil prices are influenced by a range of economic, financial, and geopolitical factors, including global supply and demand, economic growth, energy consumption, production levels, and changes in the global economy.

The decisions of OPEC and other major Oil-producing countries can have a significant impact on global Oil supply and prices. Geopolitical tensions, conflicts, sanctions, and unexpected disruptions to Oil production or transportation can also affect market conditions and increase price volatility.

The US Dollar is another important factor because Crude Oil is predominantly priced in US Dollars. Changes in the value of the US Dollar can influence Oil prices and international demand for the commodity.

Oil inventories, refinery demand, interest rates, energy policies, and global economic conditions can also influence Crude Oil prices.

Crude Oil Technical Analysis

Crude Oil Technical Analysis can help traders study important price levels and market structures. Our analysis may include support and resistance levels, trend direction, Elliott Wave counts, potential reversal areas, and different market scenarios.

As market conditions change, technical scenarios can also develop or become invalidated as new price information becomes available. For this reason, our latest Crude Oil analysis is regularly updated on this page.

Latest Crude Oil Forecast

This page brings together the latest Crude Oil Forecast and Crude Oil Analysis from Elliott Wave Monitor. New analysis posts are published regularly, allowing readers to follow Oil price movements across different market conditions and timeframes.

Whether you are looking for a Crude Oil forecast, Oil price analysis, WTI analysis, Brent analysis, Oil technical analysis, or Elliott Wave analysis, this page provides a central place to follow our latest market updates and potential price scenarios.