
WTI’s wave count has been fully revised. The four-hour chart shows 96.138, with wave 1 completed at 86.322 and a corrective wave 2 developing as a–b–c. Within c, the labels suggest (i)–(iv) have formed, leaving a potential (v) advance toward approximately 98.00. The projected decline toward 84.00 remains conditional on wave 2 completing. Breaking the (iii) high would support the final advance; losing the (iv) low would challenge its proposed completion.
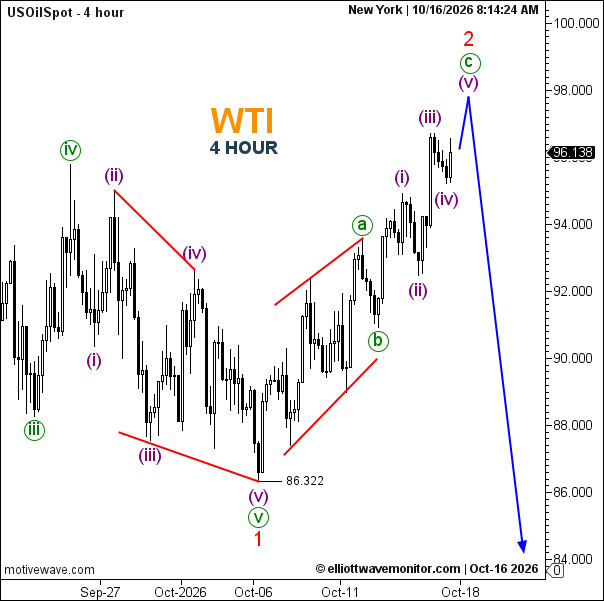
- Trend: Corrective rally within the revised bearish count.
- Trading Range: No clearly established sideways range.
- Wave Structure: Wave 2 unfolds as a–b–c; (v) of c remains anticipated.
- Support: The (iv) low near 95.00; major support at 86.322.
- Resistance: Approximately 96.75, then the projected 98.00 area.