Key Points
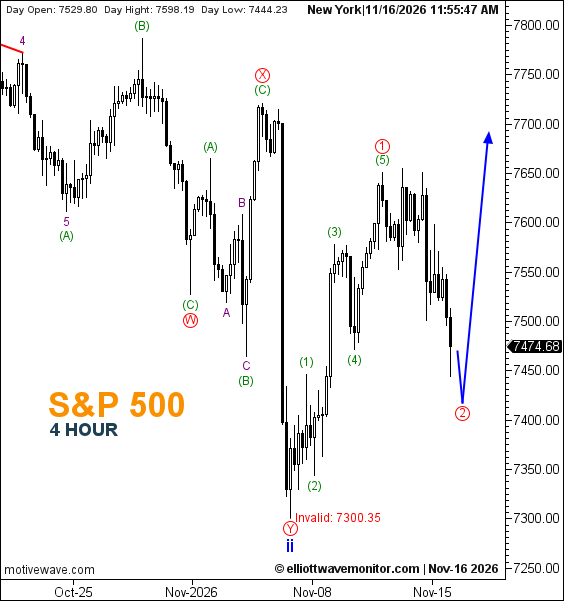
- S&P 500: The anticipated second-wave correction has progressed, while 7,300.35 is now explicitly designated as the bullish scenario's invalidation level.
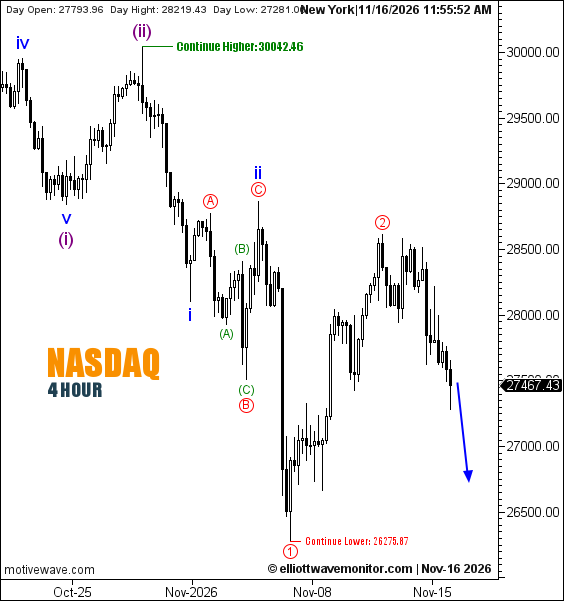
- Nasdaq 100: The decline following the previously labeled red wave 2 has extended, with further downside still projected.
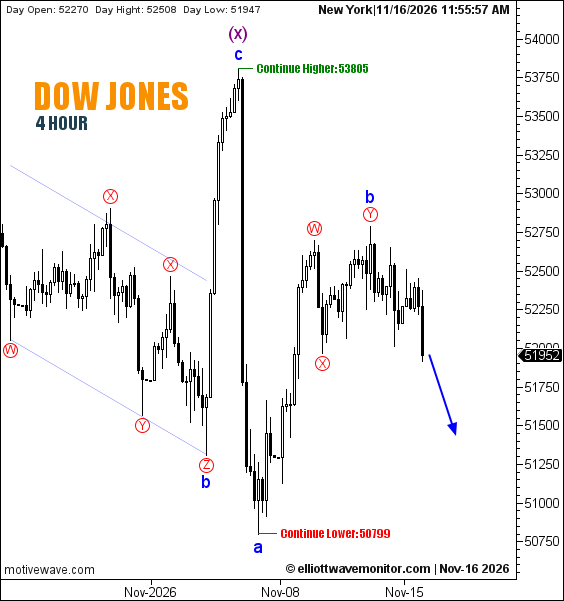
- Dow Jones: Selling has continued after the corrective blue wave b recovery, leaving the bearish continuation path intact.
The S&P 500 (SPX500) has moved further into the correction anticipated in the November 13 US indices outlook. Its four-hour chart now displays 7,474.68 at 11:55:47 a.m. New York time on November 16, with a recorded daily low of 7,444.23. The retreat has developed below the earlier chart reading of 7,628.07, although this comparison does not constitute an official daily performance figure.
The wave structure remains unchanged: the preceding five-wave green advance is labeled as red wave 1, while the connected blue projection anticipates further weakness into red wave 2 before a potential recovery. Neither the second-wave low nor the subsequent advance is confirmed. The critical technical revision concerns 7,300.35, which has been reclassified from Continue Lower to an explicit Invalidation level. The recorded daily low remains above that threshold.
In Nasdaq 100 (NAS100), the downward movement anticipated in the previous Nasdaq assessment has progressed without requiring a revision to the principal wave count. The November 16 chart displays 27,467.43 at 11:55:52 a.m. New York time, compared with 28,385.84 in the preceding snapshot.
Red wave 2 remains labeled at the earlier corrective high, and the observed candles have extended lower. The blue arrow nevertheless represents an additional projected decline, not movement already completed. The chart preserves 30,042.46 as Continue Higher and 26,275.87 as Continue Lower, with neither marked as formal invalidation.
The decline in Dow Jones (US30) has similarly developed beyond the corrective rebound documented in the November 13 Dow Jones analysis. The prior recovery remains labeled blue wave b, alongside red wave Y within the W–X–Y structure.
At 11:55:57 a.m. New York time, the four-hour chart showed 51,952, with a daily low of 51,947. The latest candles document renewed weakness, while the blue arrow anticipates a further decline. The unchanged references are 53,805 — Continue Higher and 50,799 — Continue Lower. The latter is a continuation condition, not a confirmed endpoint of the projected path.
Technical Outlook — Four-Hour Charts
| SPX500 | Red wave 2 correction progressing | Further pullback, then possible recovery | Invalidation: 7,300.35 |
| NAS100 | Decline following red wave 2 advancing | Additional downside | Higher: 30,042.46; Lower: 26,275.87 |
| US30 | Decline following blue wave b advancing | Additional downside | Higher: 53,805; Lower: 50,799 |
Trader's Question: Has the S&P 500's renewed decline invalidated its projected recovery?
Answer: Not according to the current chart. The scenario remains valid above the explicitly marked 7,300.35 invalidation level. The anticipated recovery is still conditional on completing the projected second-wave correction.